Imagine you're bringing a new team member on board in your company. There's much to explain about how things work, which can get confusing. That's where process flowcharts step in, like helpful guides. They're like roadmaps that make complex procedures easy to understand.
In this guide, you will explore process flowcharts, their makers, and more. It will also dive into the ins and outs of these diagrams and free flowchart templates that you can use. By the time you finish reading, you'll have all the knowledge you need to use these diagrams effectively and streamline your work processes.

In this article
Part 1. Crash Course: Process Flow Diagrams
Process flow diagrams are like roadmaps for your business processes. They visually represent how things get done, helping you and your team understand and improve processes. These diagrams use standardized symbols and shapes to describe various steps, activities, and decisions within a process.
At its core, a process flow diagram (PFD) is a simple yet powerful tool that illustrates how tasks, data, and information move from one step to another within a process. It allows you to see the big picture and the tiny details simultaneously.
Part 2. History of the Workflow Diagram
Process Flow Diagrams (PFDs) show how workflows and processes evolve. They also show how they streamline operations and boost efficiency in different industries and businesses. In this section, the history of these diagrams will be explored.
Early Beginnings
In the early 20th century, industrial engineers and efficiency experts began using hand-drawn flowcharts to map workflows. While rudimentary, these diagrams marked the inception of process visualization.
The 1950s witnessed a significant development with the rise of structured analysis, particularly in computer programming and systems analysis. Flowcharts became more organized and structured, finding crucial applications in software development and business analysis.
The 1960s brought standardization to process flow diagrams as organizations and experts adopted standardized symbols. This standardized approach introduced consistency, with rectangles representing processes, diamonds for decision points, and arrows indicating the flow of operations.
Modern Development
The 1980s saw the shift from manual to computer-aided diagramming. The advent of software tools made it easier to create, edit, and share process flow diagrams. In the present day, process flow diagrams are indispensable tools in various industries, including manufacturing, healthcare, and more. Today, several flowchart makers aid professionals in easing their work.
Part 3: Process Flow Diagram Examples
This section will explore various types of process flow diagrams and their practical applications. Each diagram type offers unique features tailored to specific needs. They work whether you're simplifying a basic procedure, managing intricate projects, or optimizing manufacturing processes.
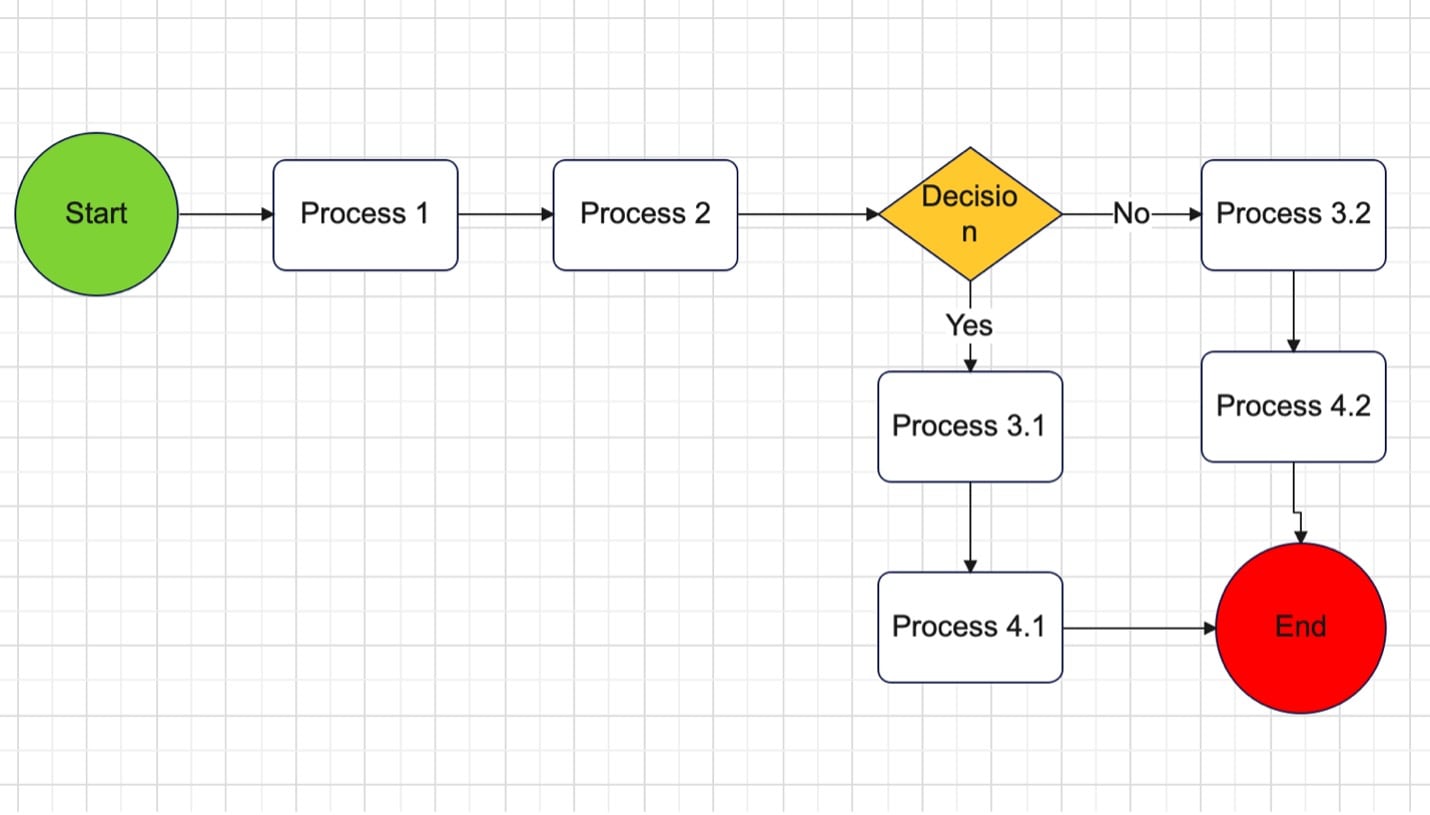
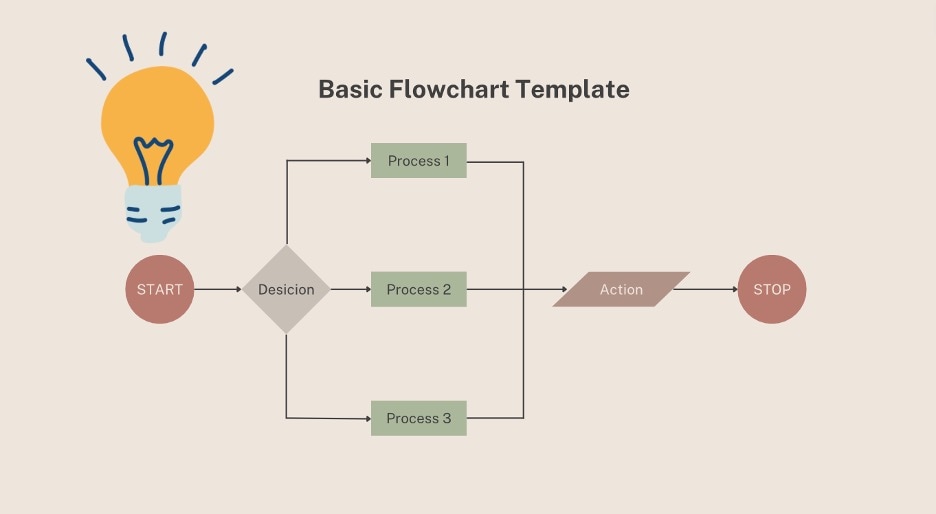
Basic Flowchart Diagram
The Basic Flowchart Diagram template is the go-to choice to map out simple processes, visualize decision-making workflows, or document fundamental procedures. It's perfect for breaking down tasks and activities into easy-to-understand steps. This is an invaluable tool for process analysis, improvement, and communication.

 below.
  below.
 Swimlane Diagram
The Swimlane Diagram template is essential for visualizing processes that involve multiple participants or departments. It's beneficial for showcasing responsibilities, dependencies, and handoffs within complex workflows.
Using swimlanes to segregate different contributors, you can streamline communication and enhance accountability. You can also gain a holistic view of how various entities contribute to the overall process.

Value Stream Mapping
Value Stream Mapping is an essential tool for analyzing, optimizing, and improving the flow of materials and information within manufacturing or service processes. With the help of this template, you can create detailed visual representations of your current and future state value streams.
It will assist you in identifying bottlenecks, eliminating waste, and enhancing overall efficiency. You will be able to uncover opportunities for continuous improvement. This will help you reduce lead times and deliver more value to your customers.

Gantt Chart
The Gantt Chart template is your go-to solution for project management. It's designed to help you effectively plan, schedule, and track tasks, timelines, and dependencies. You can create comprehensive project plans and allocate resources effectively.
Whether overseeing a complex construction project or managing a product launch, this template empowers you to keep your projects on track, meet deadlines, and achieve successful outcomes.

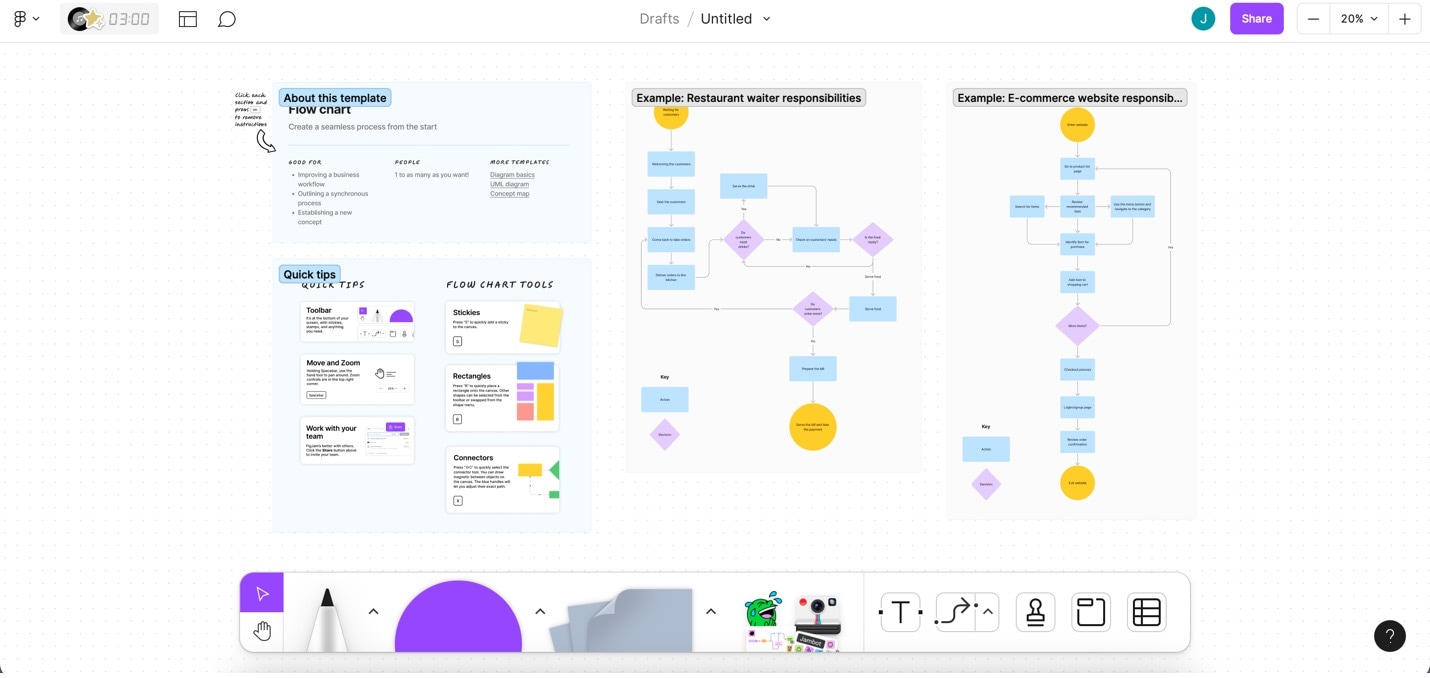
The templates you've seen are all from EdrawMax's Template Community, a user-powered template collection where you can share and download flowchart templates with other Edrawers. Explore the community if you need more examples.
Part 4. How To Create Process Flowchart Diagrams
After discussing the importance and range of process flow diagrams, it's time to delve into the process of making them. Creating a process flowchart involves a few basic steps, including adding shapes, including text, establishing connections between elements, and using colors to improve visibility. You can draw manually or use flowchart makers to ease the process.
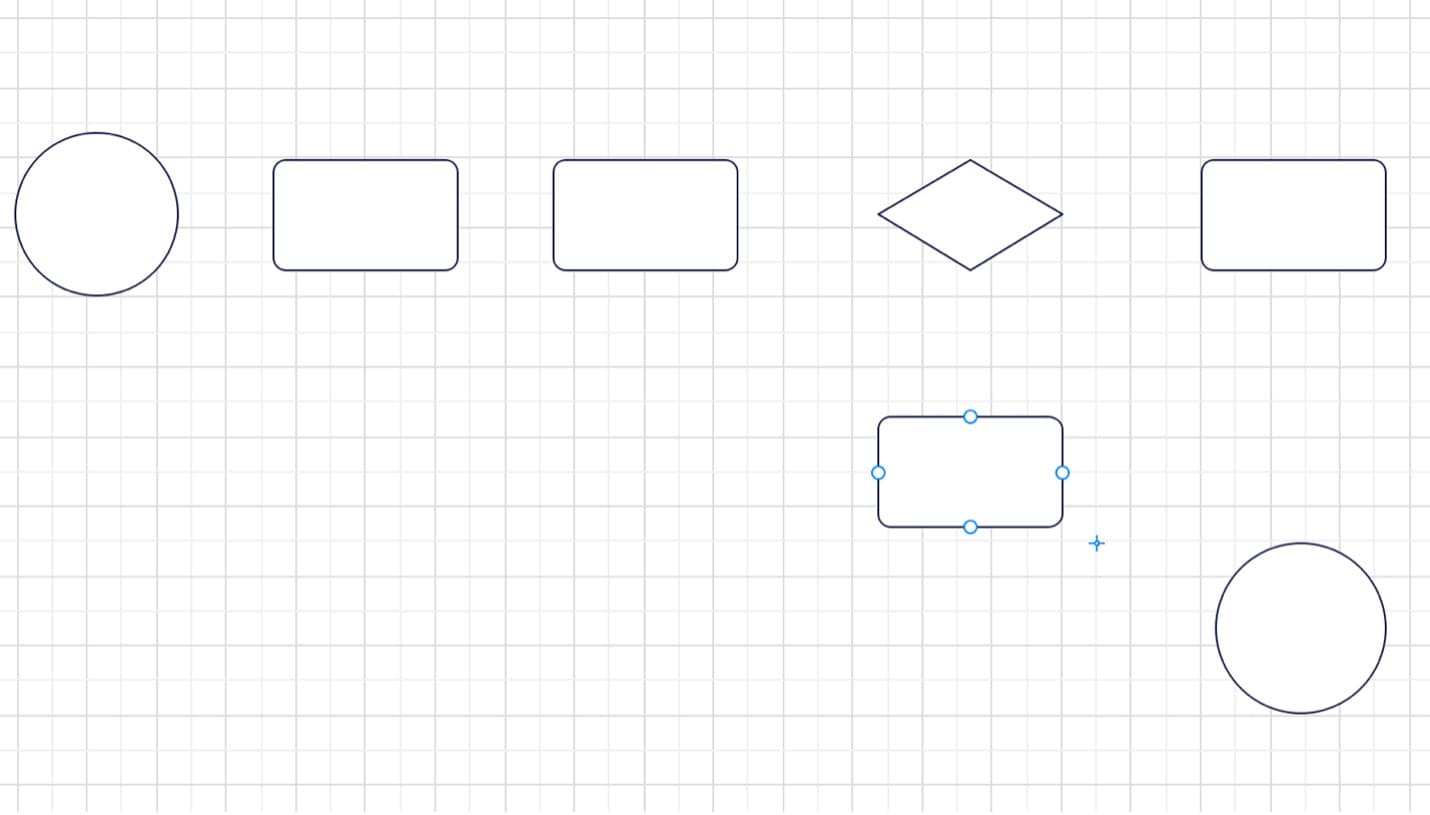
Step1Select Shapes
Begin by choosing the appropriate flowchart symbols for your diagram. These symbols represent different processes, decisions, and actions within your flowchart.
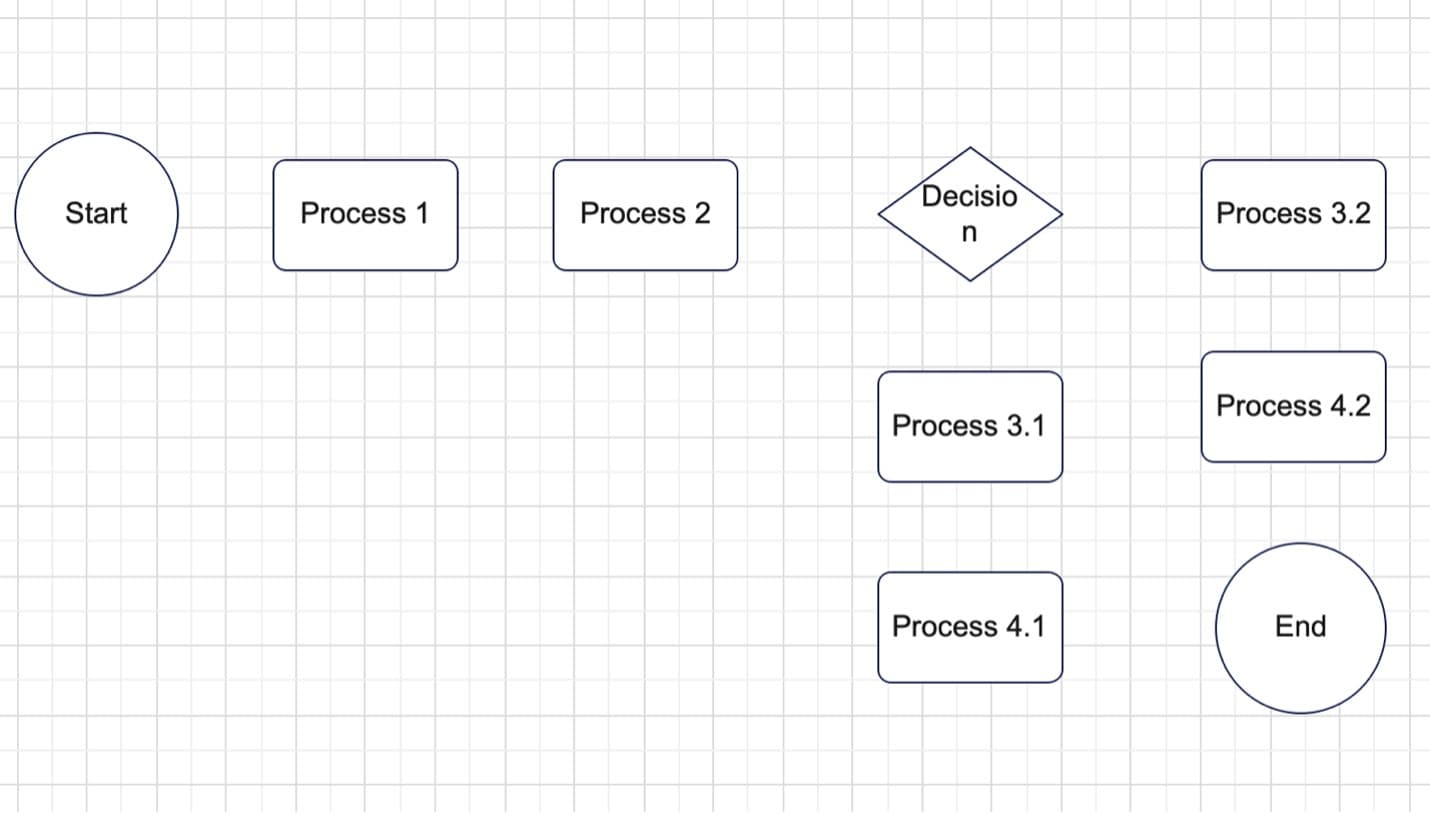
Step2Label with Text
Add clear and concise text to label each flowchart symbol. Text is essential for explaining the purpose or function of each element in your flowchart. Ensure that the text is legible and informative.
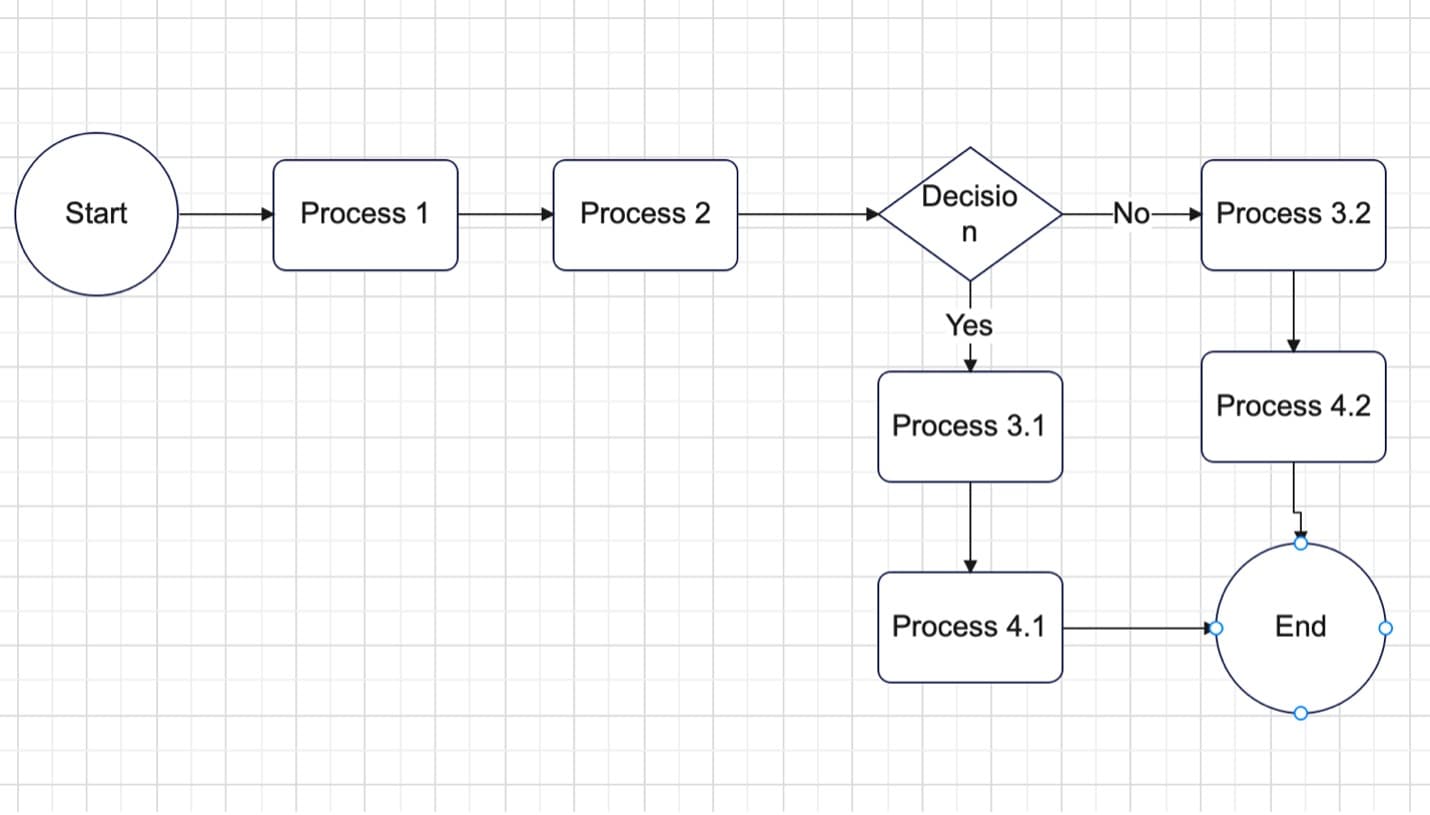
Step3Establish Connections
Use lines or arrows to connect the flowchart symbols and represent the flow or sequence of steps. Arrows typically indicate the flow direction, while lines show connections or transitions.
Step4Apply Colors
Employ colors thoughtfully to enhance the visual clarity of your flowchart. Colors can be used to differentiate between elements, highlight critical steps, or group-related actions.
hese fundamental steps guide how to create effective flowcharts, which are valuable tools for visualizing processes, decision-making, and workflows.
Part 5. Components of Process Flowcharts
Process flowcharts utilize various shapes and symbols to convey information effectively. Understanding these components is crucial for creating clear and concise diagrams. Here are the key elements commonly used in process flowchart diagrams:
- Process Nodes. These rectangles represent a specific task, action, or step in the process. They are the building blocks of your flowchart, outlining each activity.
- Decision Nodes. Diamonds indicate decision points within the process where a choice must be made. Depending on the condition, the flow may follow different paths.
- End/Start Nodes. These oval shapes represent the beginning and end points of the process. Typically, a process starts with a "Start" node and concludes with an "End" node.
- Input/Output Nodes. Parallelograms are employed to signify inputs or outputs in the process. They indicate data or materials entering or leaving the system.
- Connectors. Arrows or lines with arrows at both ends connect nodes, showing the flow or sequence of tasks. They guide the reader through the process from start to finish.
Mastering these essential components and their meanings will allow you to construct process flowcharts that effectively convey information and facilitate a better understanding of complex processes. Do not worry; most modern flowchart makers have already adjusted to these standard symbols. Load up a tool, and they will ease the job for you.
Part 6. Tips for Creating Process Flowcharts
Creating process flowcharts can be a powerful way to streamline complex processes and improve communication within your team. To ensure your flowcharts are practical and easy to understand, consider these valuable tips:
- Keep It Simple. Flowcharts are most effective when they are clear and straightforward. Use concise language and simple shapes to represent actions and decisions. Avoid unnecessary complexity that can confuse the reader.
- Use Distinct Colors. Employing different colors for various stages or elements in your flowchart can enhance visual clarity. For instance, you might use one color for process steps, another for decision points, and another for connectors. This color differentiation makes it easier for the audience to follow the flow.
- Add Pictures. A visual representation can clarify a step or process more effectively than text alone. Consider incorporating simple icons or images to complement your flowchart. This can be especially helpful when dealing with complex procedures.
- Annotate When Needed. While flowcharts should generally be concise, there may be occasions when you need to provide additional context or explanations. These annotations can provide valuable insights without cluttering the diagram.
With the help of these techniques, you can create process flowcharts that are both informative and visually appealing. Whether you are documenting a business process, outlining project workflows, or mapping out a series of steps, these tips will assist you in effectively conveying your ideas.
Part 7. Three Recommended Apps To Create Process Flow Diagrams With
When creating process flow diagrams, having the right tool can significantly impact your charts' efficiency and quality. Here are three recommended apps that excel in this regard:
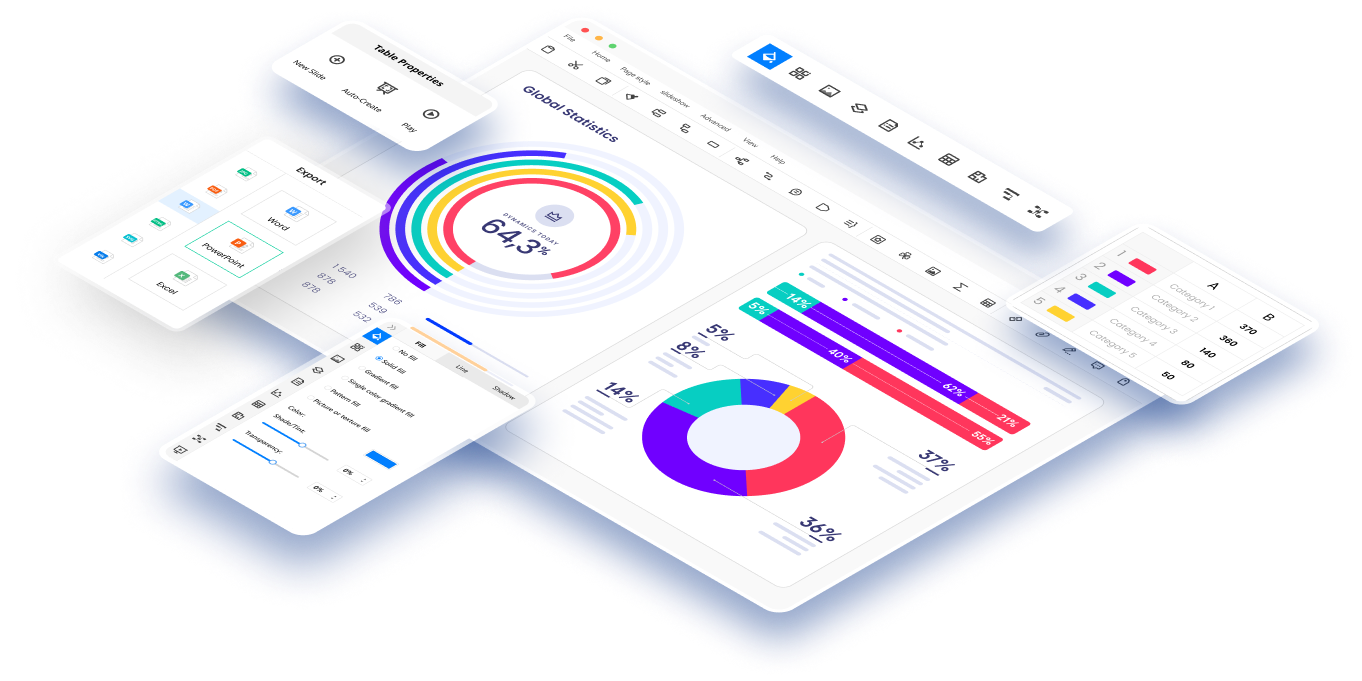
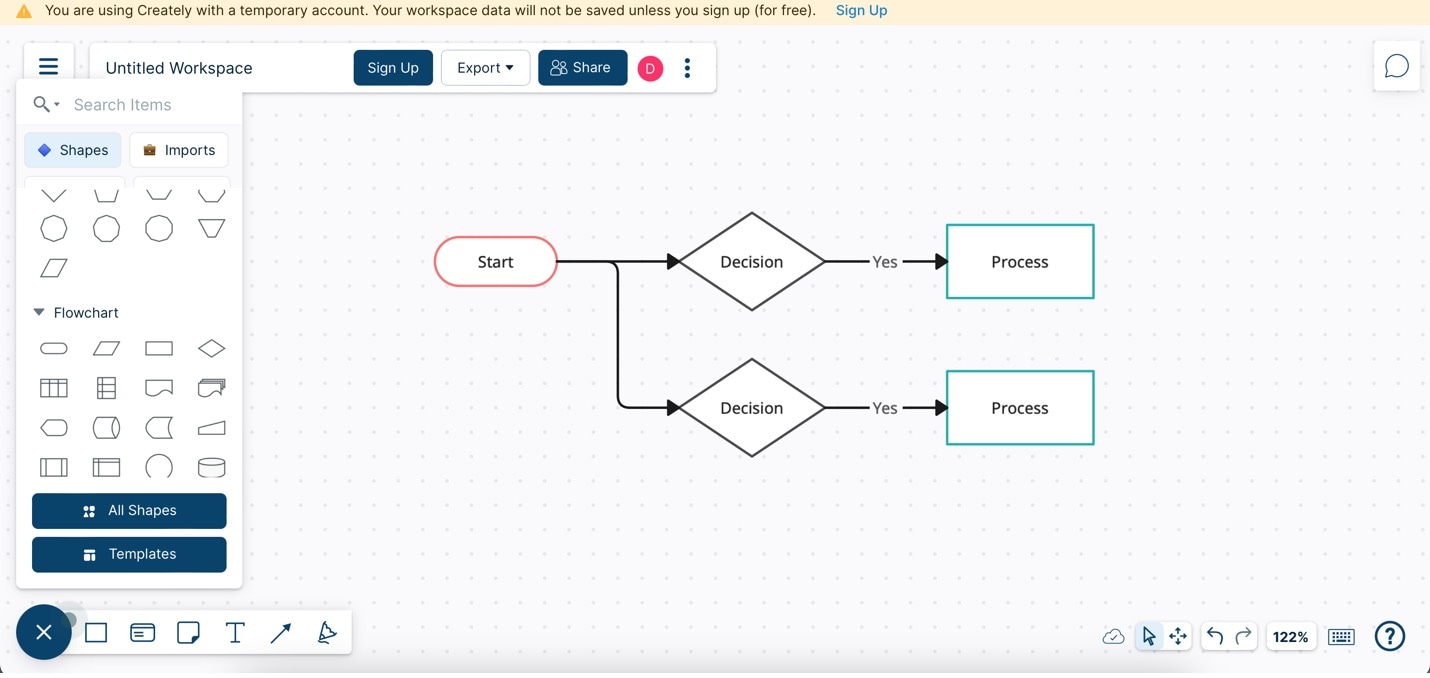
Wondershare EdrawMax
This versatile software is an excellent choice for process flow diagrams. It's free, easily accessible online, and offers many templates that simplify diagramming. The charts used as examples in Part IV was made using this application.

Here are its key features that you would love:
- Free Access. EdrawMax offers free access to its versatile diagramming features, making it accessible to users on various budgets.
- Online Convenience. EdrawMax is available online, allowing you to create process flow diagrams from anywhere with an internet connection.
- Template Variety. It boasts an extensive library of templates, streamlining the diagram creation process with pre-designed elements.
- Infinite Canvas. EdrawMax provides an endless canvas, ensuring ample space to map out complex processes.
- AI Tools. Integrated AI tools enhance diagramming efficiency by one-click generating and suggesting shapes, layouts, and connections. This helpful feature saves you time and effort.
FigJam
FigJam is a collaborative online whiteboard tool that can be incredibly useful as a flowchart maker. It enables real-time collaboration with your team, making it easier to brainstorm and map out processes collectively. FigJam offers a straightforward interface, making it accessible for beginners and experienced users.
Creately
Creately is another excellent free flowchart software. It provides a user-friendly platform with templates and shapes that cater to various diagramming needs. Creately also supports collaboration, making it suitable for team projects. It also has a dedicated flowchart creator tool system, which makes it an amazing partner for creating these diagrams.
Conclusion
You've delved into how to create these diagrams and their essential components. Process flowcharts are crucial in simplifying complex procedures, improving communication, and enhancing efficiency. They're indispensable tools for businesses, educators, and individuals alike.
To streamline your diagramming journey, harnessing the power of flowchart makers like EdrawMax is recommended. With its user-friendly interface, a wealth of templates, and AI-driven features, EdrawMax empowers you to create compelling process flowcharts effortlessly. Start simplifying your processes today with EdrawMax.