


17 types of flowcharts and when to use them


Whether you're figuring out complicated workflows, mapping out how systems interact, or showing the order of important events, flowcharts are the perfect tool for making sense of scattered information. These versatile diagrams help illustrate the steps in a process or actions within a system.
Since there are so many scenarios you’d want to organize information, there are also many different types of flowcharts. This post will cover:
- 17 types of flowchart diagrams
- Key characteristics of basic flowcharts
- Flowchart FAQs
- FigJam’s collection of flowchart templates
Map your flowchart with a free template today
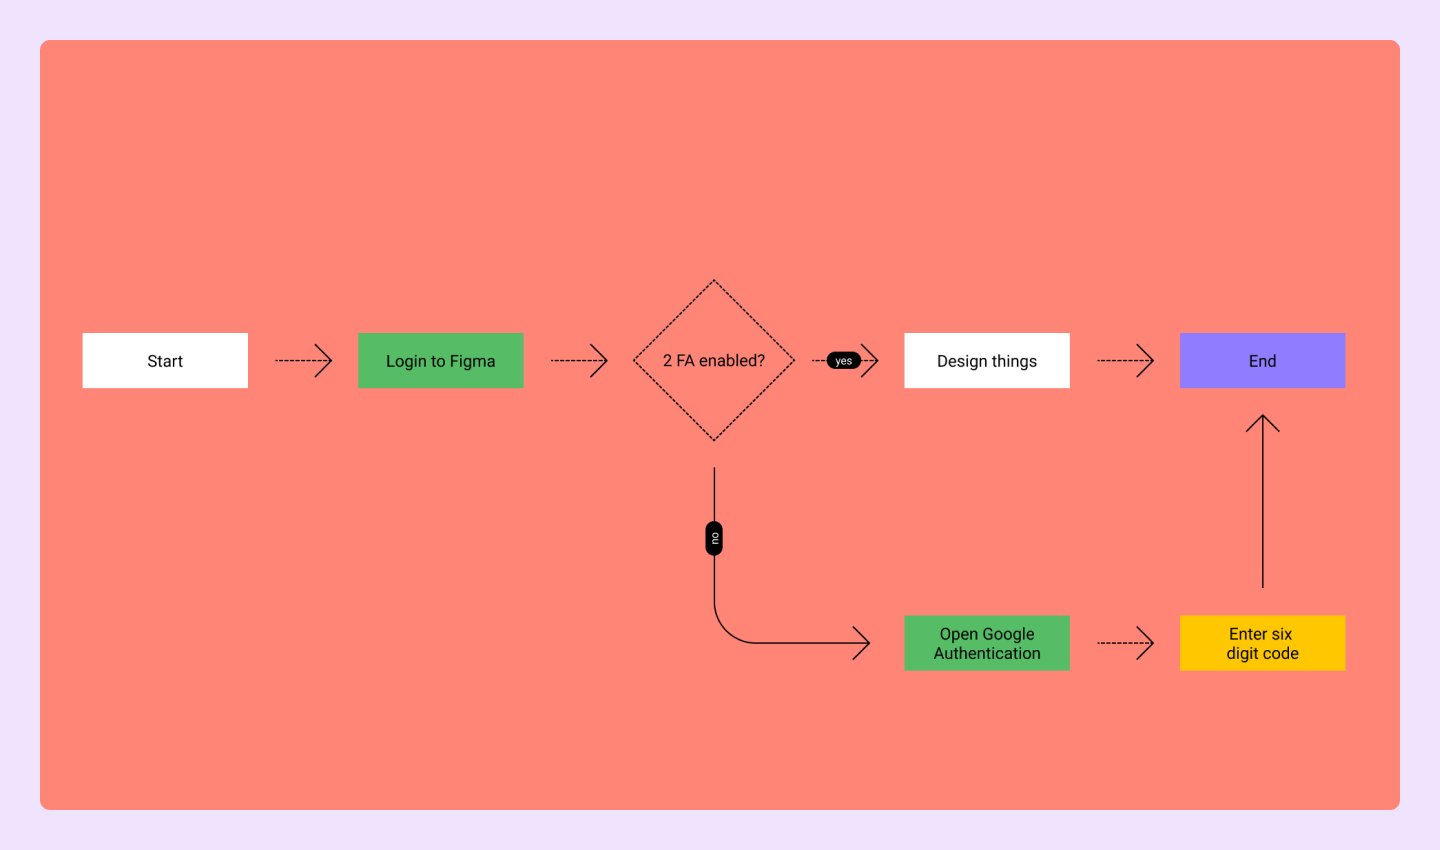
Type 1: Process flow diagram

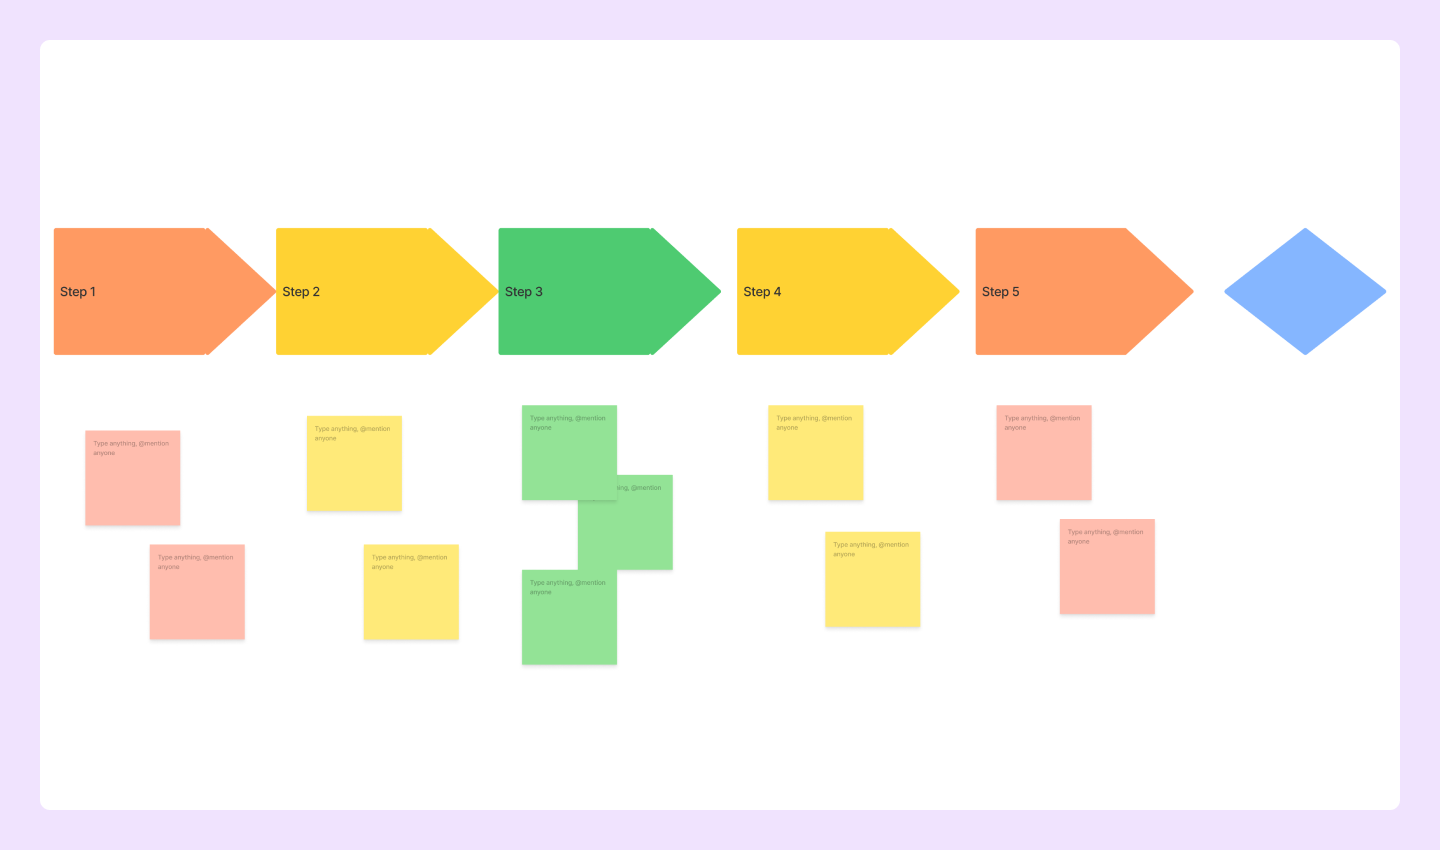
Best for: outlining steps and decisions in a process
Process flow diagrams, or process maps, visualize the step-by-step sequence of tasks in a process. This type of flowchart shows every step in a project, providing important details like timelines, resources, and teams needed to complete each step. Process flow diagrams are commonly used in engineering, business management, and product design to streamline project planning.
Try this process map template to get started.
Type 2: Workflow diagram

Best for: illustrating and refining team workflows
A workflow diagram visualizes the steps in a business process. Each step maps out the tasks or actions an employee or team must complete to finalize the process. Its simple design makes it easy to refine existing workflows or guide new hires through a new process.
Outline or rework your process with this workflow diagram template.
Type 3: Data flow diagram

Best for: explaining how data moves through a process or system
A data flow diagram (DFD) helps you understand how data flows through a system. A DFD simplifies complex processes by breaking them down into interconnected bubbles and arrows, creating a visual representation of how data moves and changes. For instance, a software developer might employ a DFD to map how user input is processed within a software system.
Map your information flow with this data flow diagram template.
Type 4: Swimlane flowchart

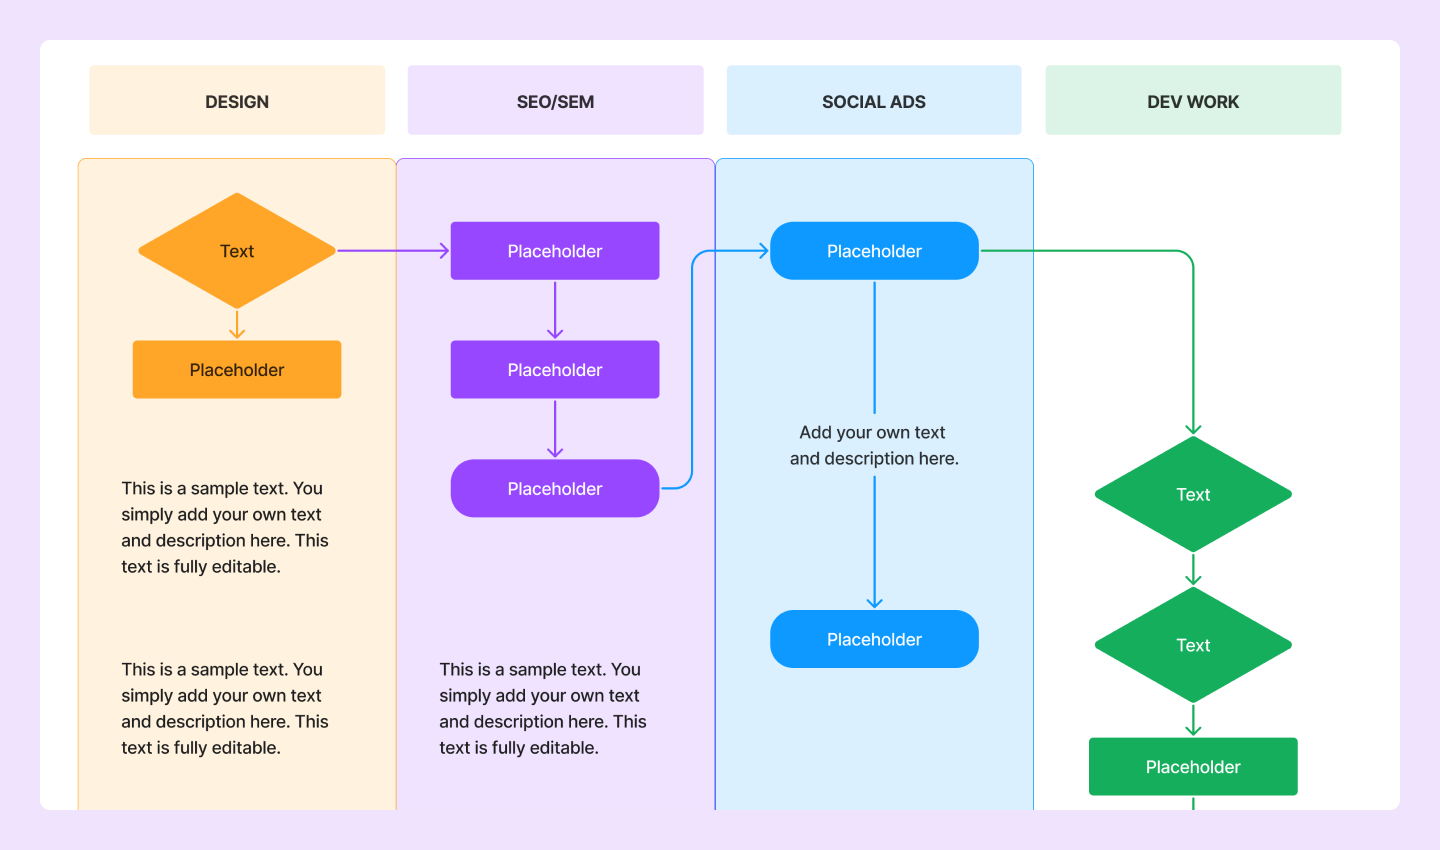
Best for: explaining how different teams work on cross-functional processes
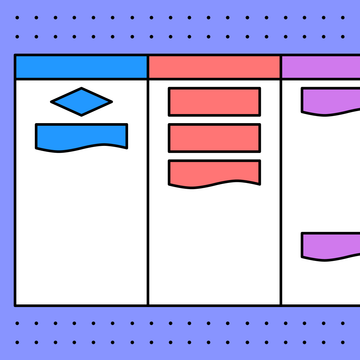
Swimlane diagrams display how different roles approach steps in a shared process or workflow. Each “lane” in this diagram type represents a different role or department, showing who's responsible for each step. Swimlane flowcharts can be used by teams, project managers, and leadership to improve communication and drive a project forward.
Define who does what and when with this swimlane diagram template.
Type 5: Decision tree diagram

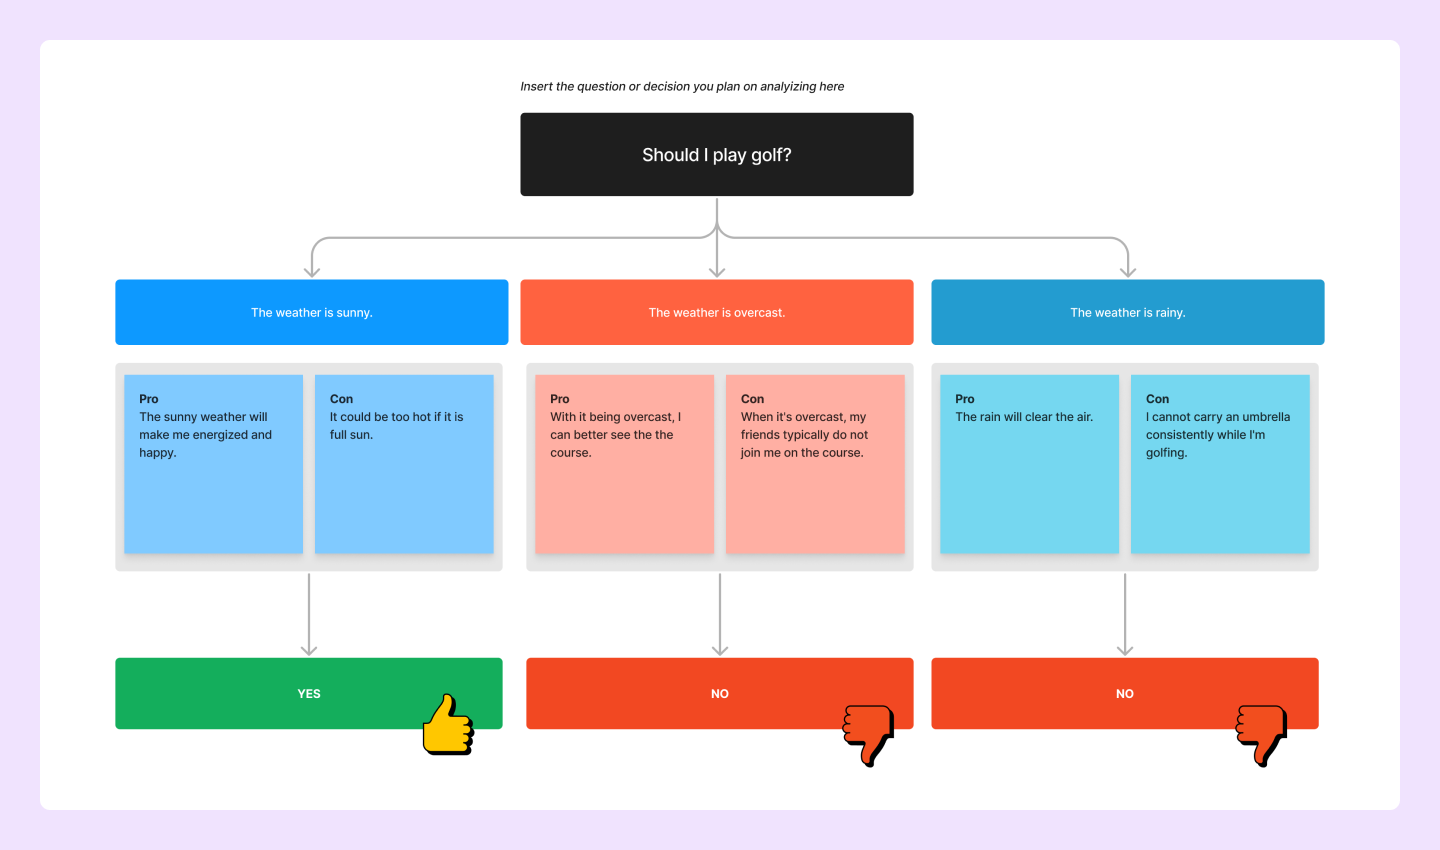
Best for: identifying inefficiencies, challenges, and opportunities for process improvement
Decision tree diagrams help you analyze options and ideas by illustrating possible outcomes of different decision-making paths. By guiding you through a series of yes-no questions, decision tree diagrams help identify how specific business decisions could unfold.
Start mapping your choices with this decision tree diagram.
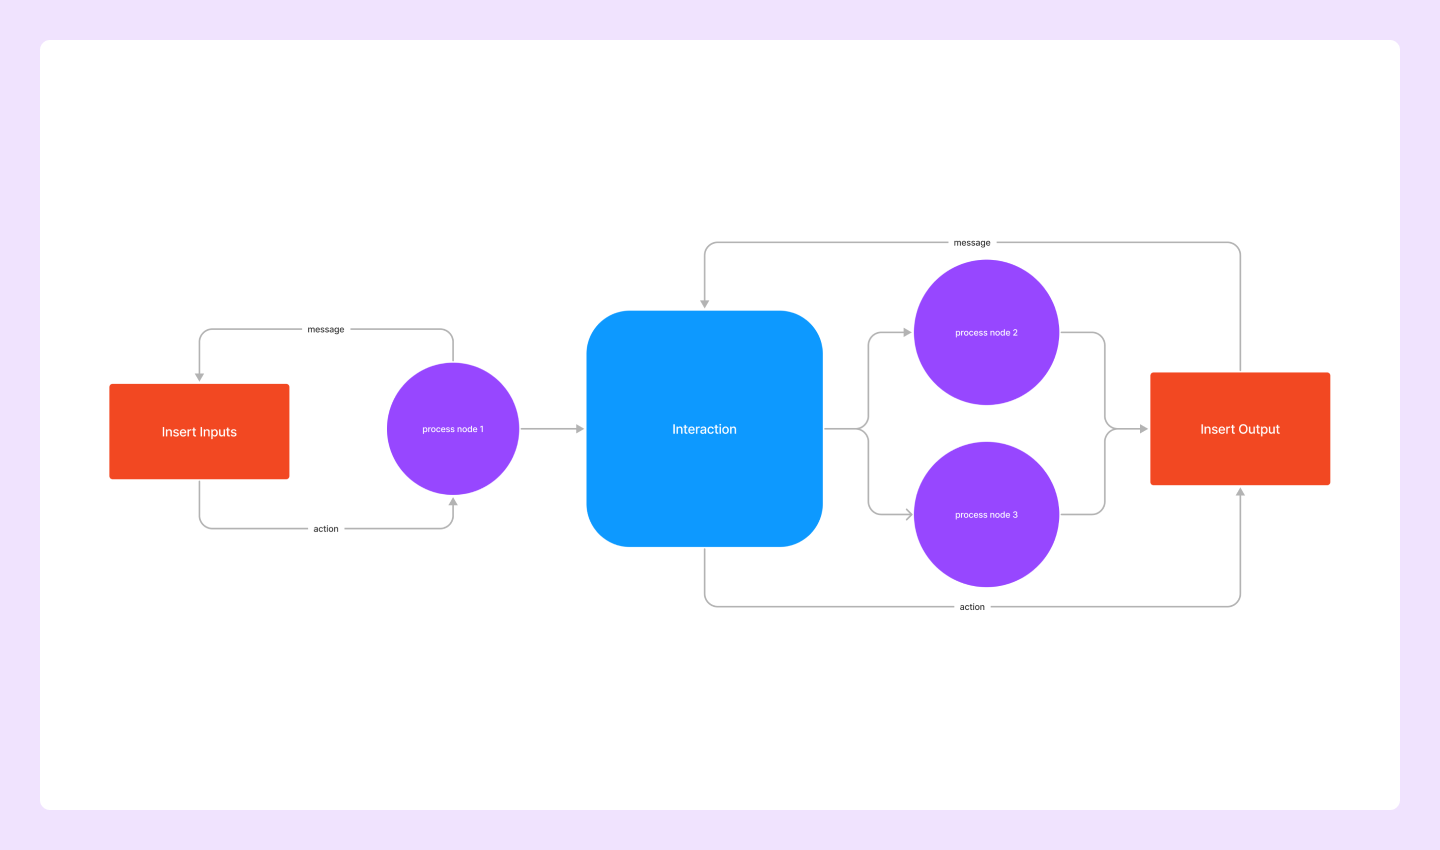
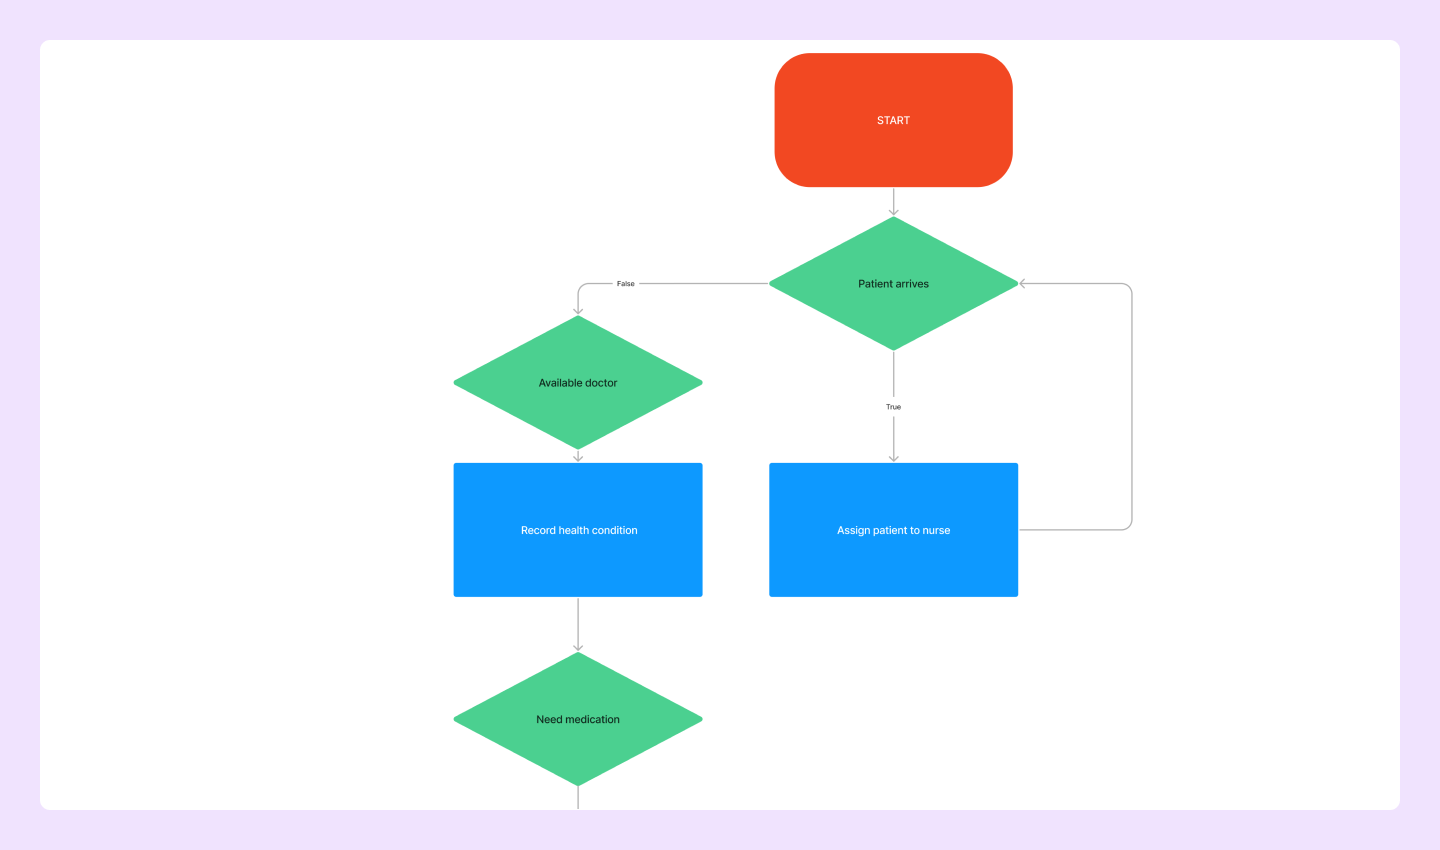
Type 6: System flowchart

Best for: showing how external inputs get processed in a system
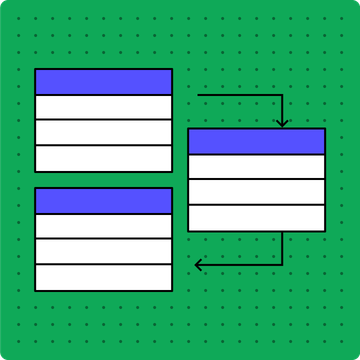
A system flowchart, also known as a software flowchart, outlines data flow and how external inputs influence decisions. It uses shapes and arrows to map the order of operations, making it easy to track data paths and process connections. For example, a software developer might use a system flowchart to visually map the interactions between different modules in a software system.
Diagram how your complex systems work with this system flowchart template.
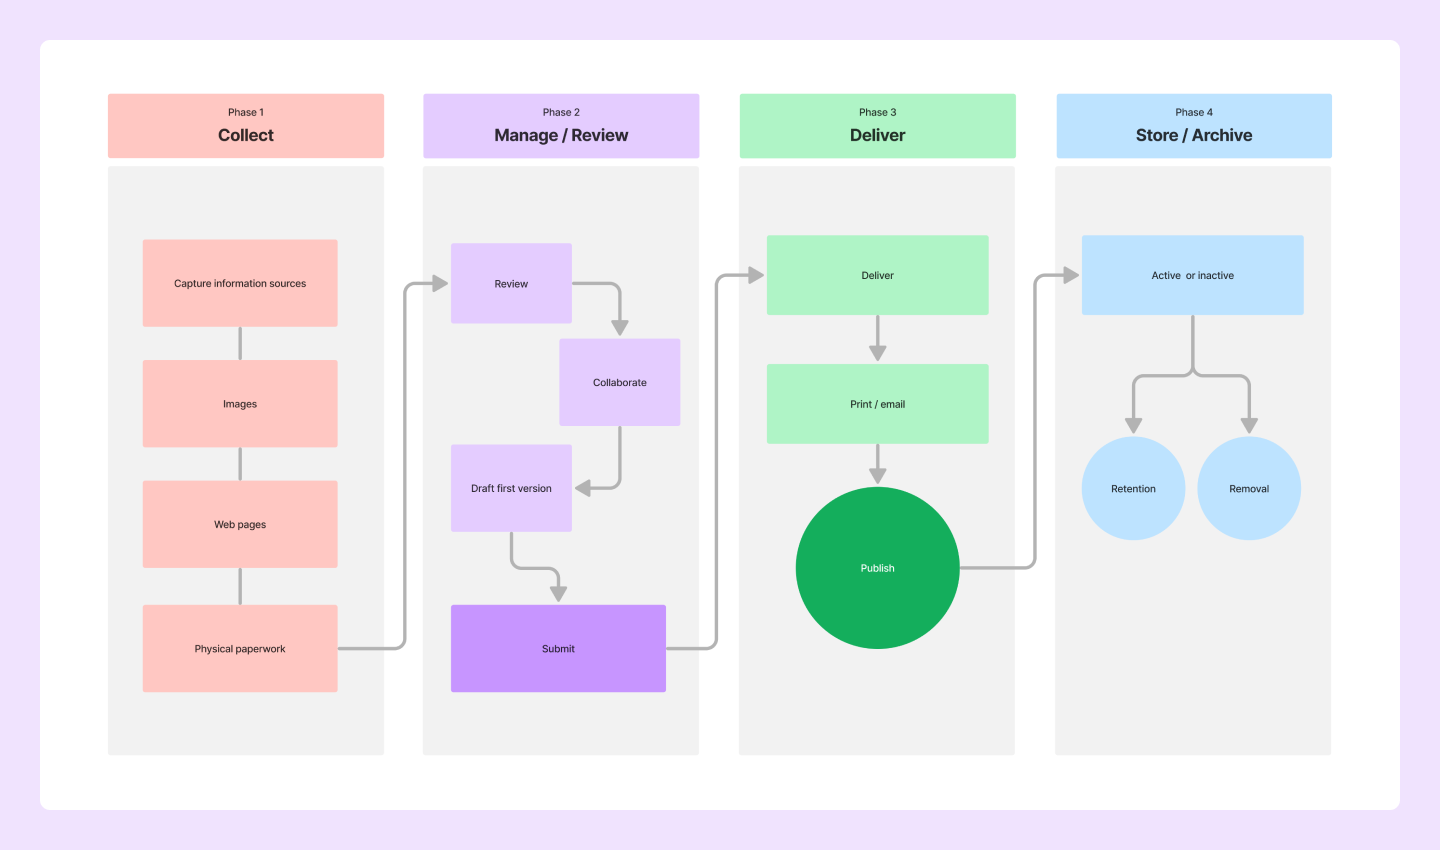
Type 7: Document flowchart

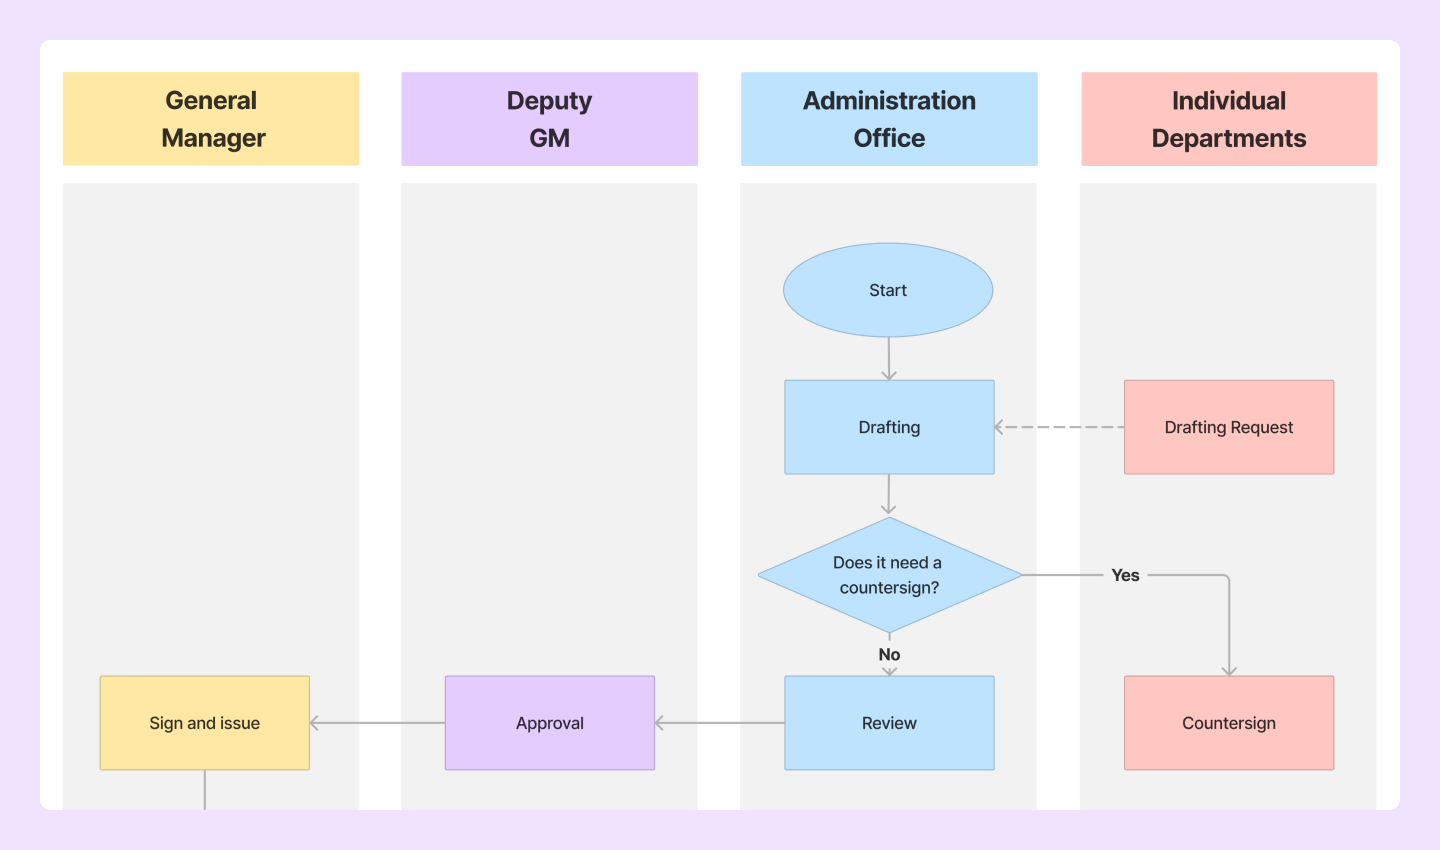
Best for: important forms requiring multiple approvals
Document flowcharts outline the necessary steps and people involved in approving a document. These flowcharts detail the steps, departments, and people needed to draft, review, and sign the document before it is considered final.
Chart your document flows with this document flowchart template.
Type 8: Product flowchart

Best for: manufacturing or supply chain management teams
A product flowchart shows how a product moves from creation to delivery, outlining key stages and decisions. It helps visualize the flow of materials and tasks as they go through different stages in the production process.
Stay on top of development with the product flowchart template.
Type 9: PERT chart

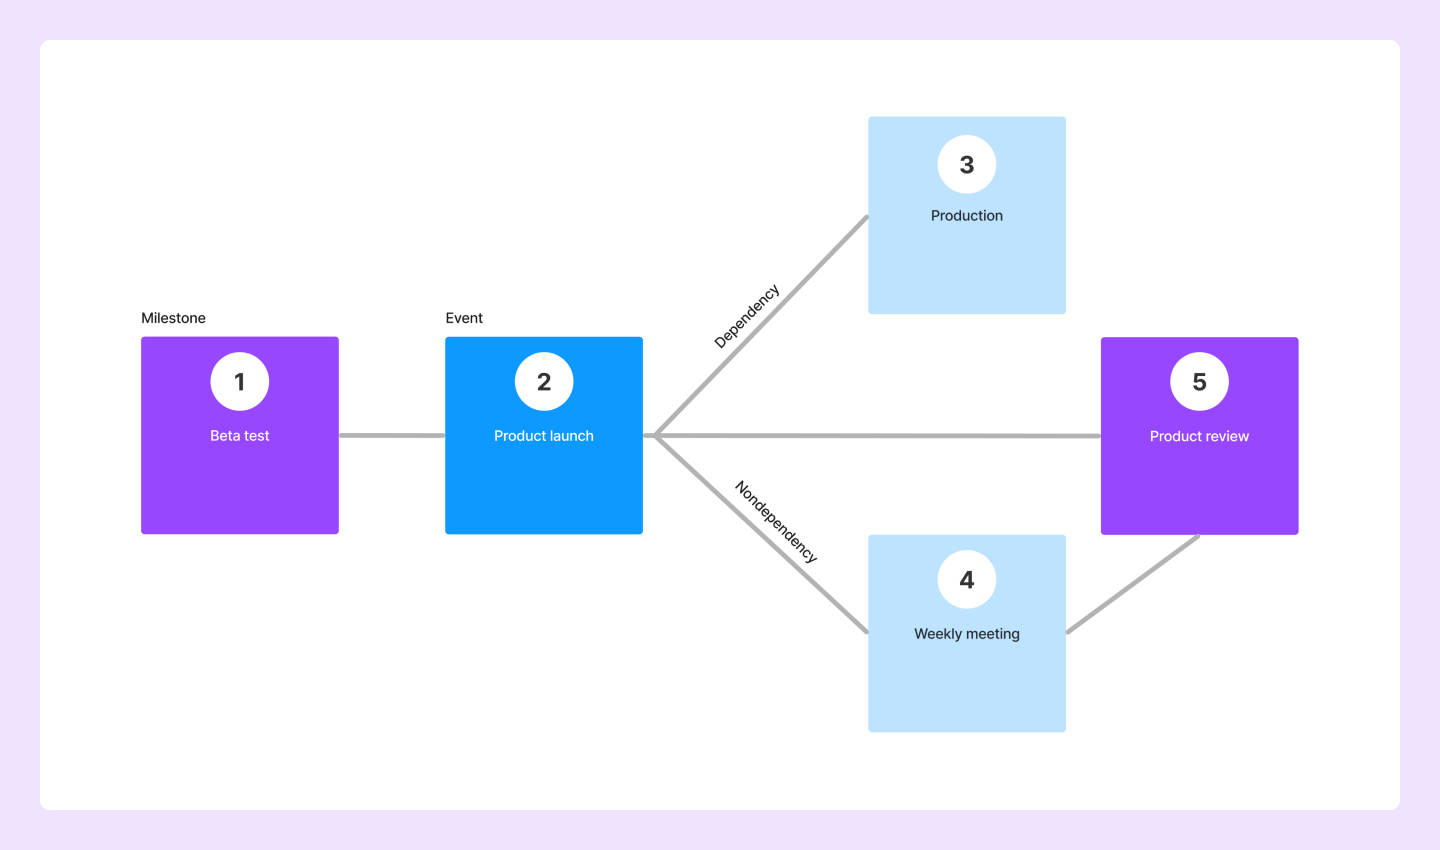
Best for: ensuring projects stay on schedule and meet deadlines
A project evaluation review technique (PERT) chart breaks down a project’s tasks and dependencies in order according to a timeline. This type of flowchart helps your team meet objectives and milestones and stay on track at every stage.
Project managers can use PERT charts to allocate resources and stay ahead of potential issues, making sure projects stay on schedule and meet their deadlines.
Sequence the order of tasks for your teams with the PERT chart template.
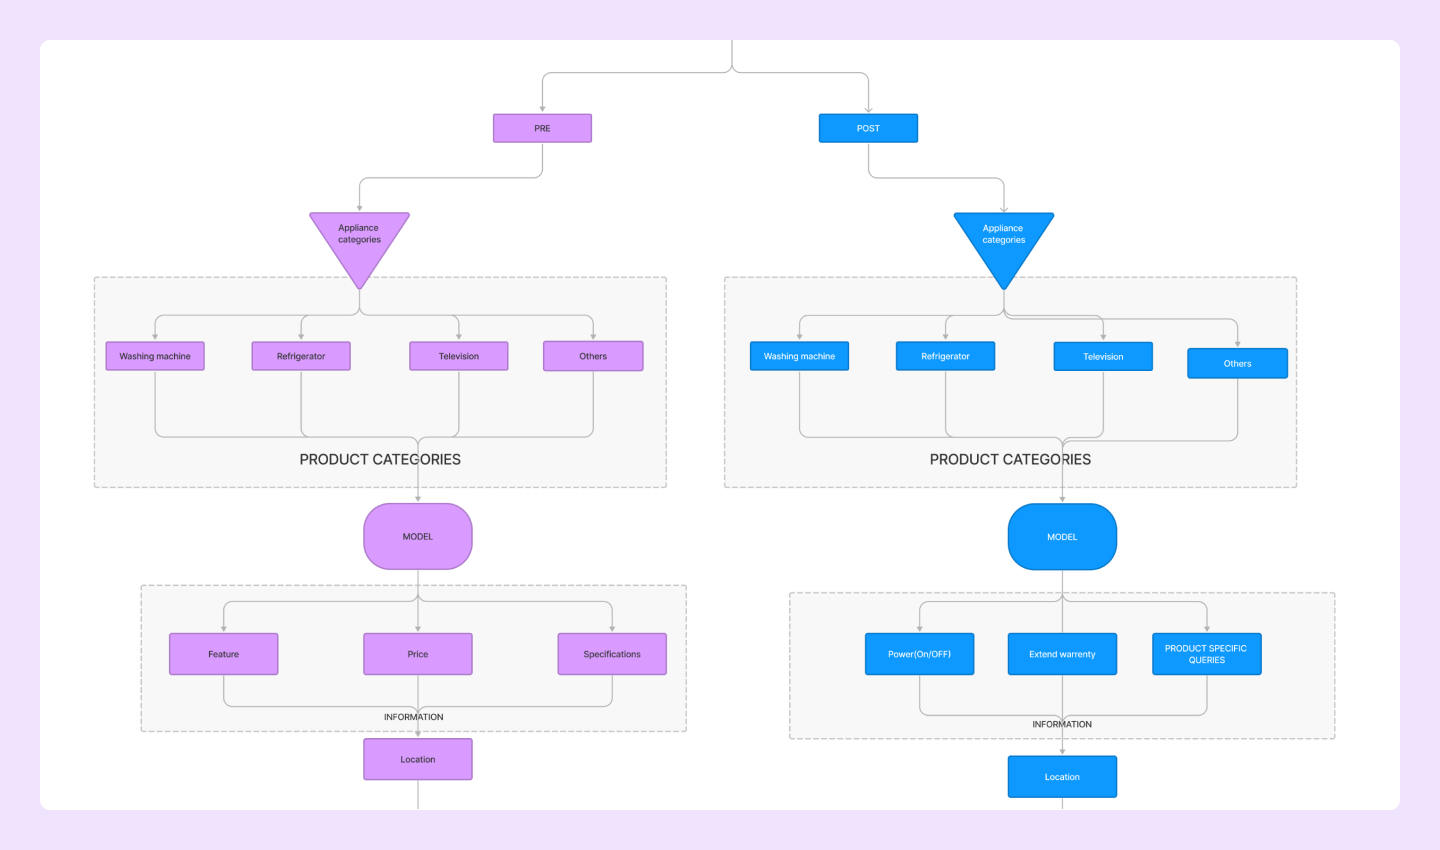
Type 10: Use case flowchart

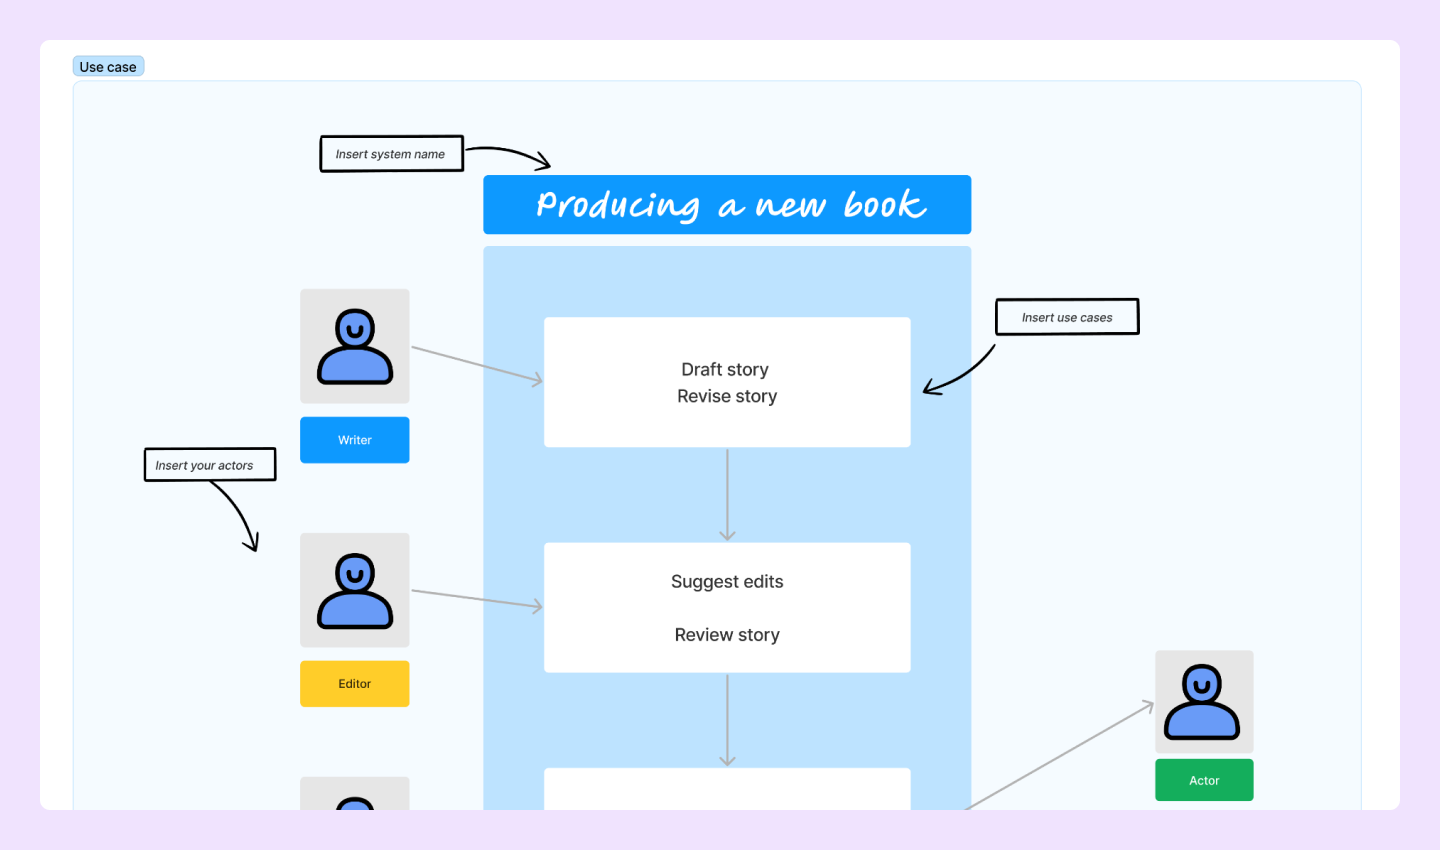
Best for: visualizing user experiences within a product or system
Use case flowcharts offer a detailed view of the user journey within a system or product by breaking down user interactions and mapping actions to outcomes. This visualization helps designers create user-centric experiences during development.
Try this use case flowchart template to see how users interact with your system.
Type 11: Event storming flowchart

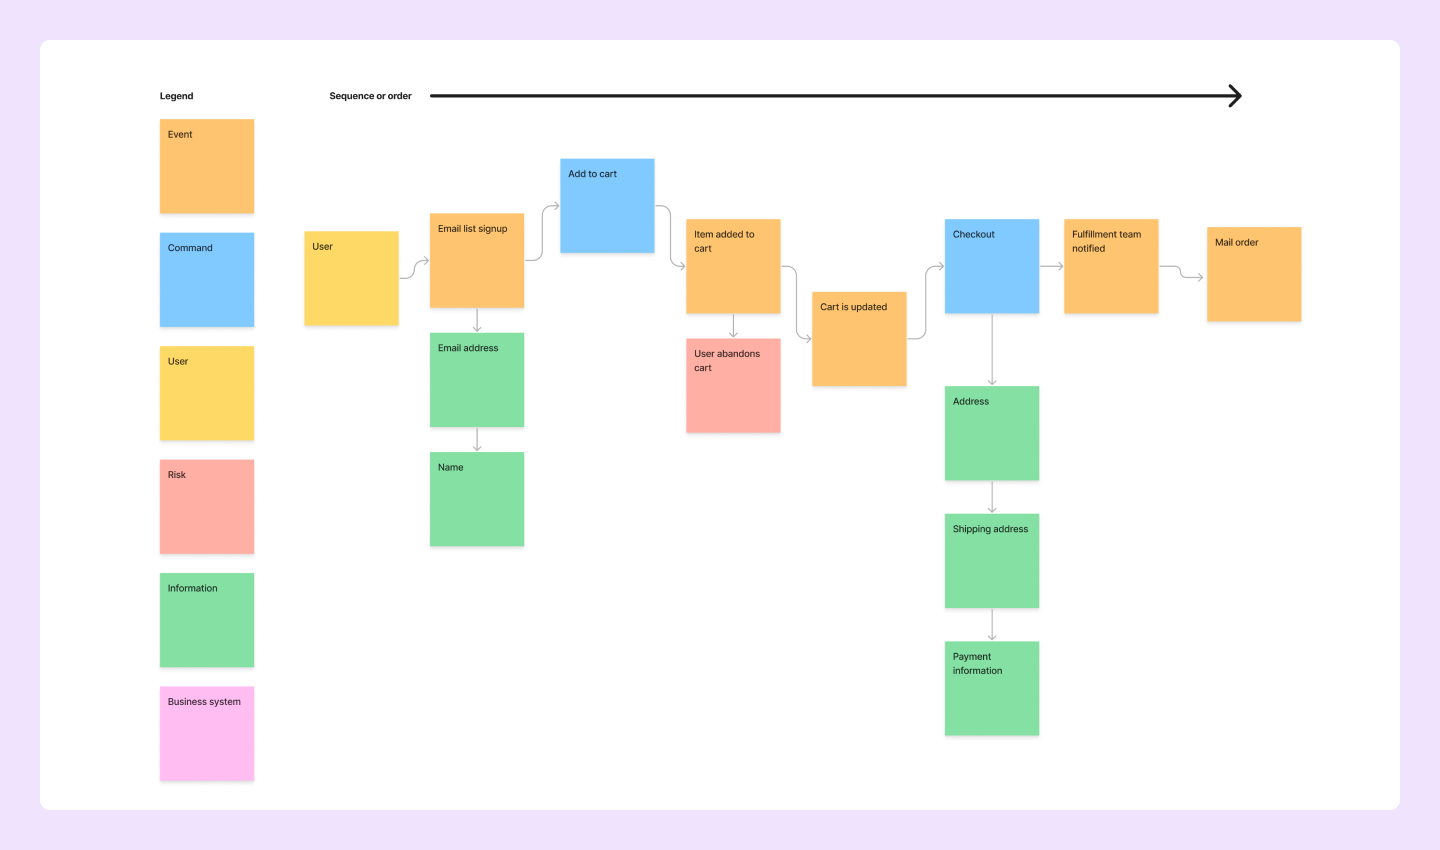
Best for: mapping the requirements needed for a program or process to work
Event storming flowcharts visually outline simple sequences of events needed to make a program run. They give high-level overviews of key players and processes — making them great for brainstorming, communicating ideas, and getting feedback before, during, and after a project.
Start storming with this event storming flowchart template.
Type 12: Customer journey flowchart

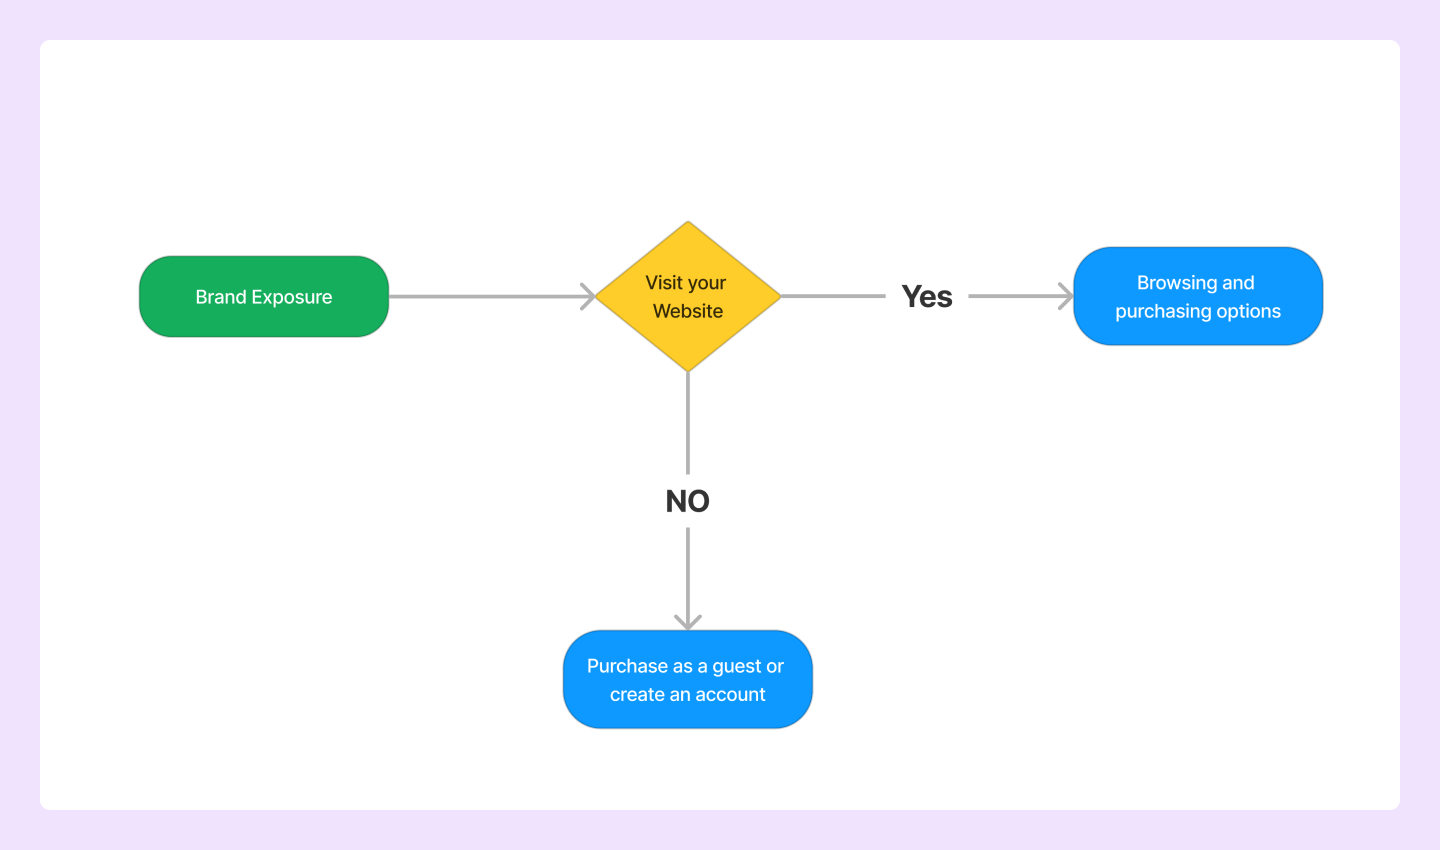
Best for: charting the flow of customer interactions leading to a conversion
Customer journey flowcharts illustrate the steps a customer takes from discovering your brand to making a purchase. It’s a visual story that helps you evaluate two things:
- How effective marketing is in attracting users
- The website’s ability to convert visits into sales
For example, product teams may use this flowchart to better understand customer touchpoints and interactions. This could be helpful for brainstorming better processes, like onboarding, for your customers.
Enhance user experiences with a customer journey map template.
Type 13: Production flowchart

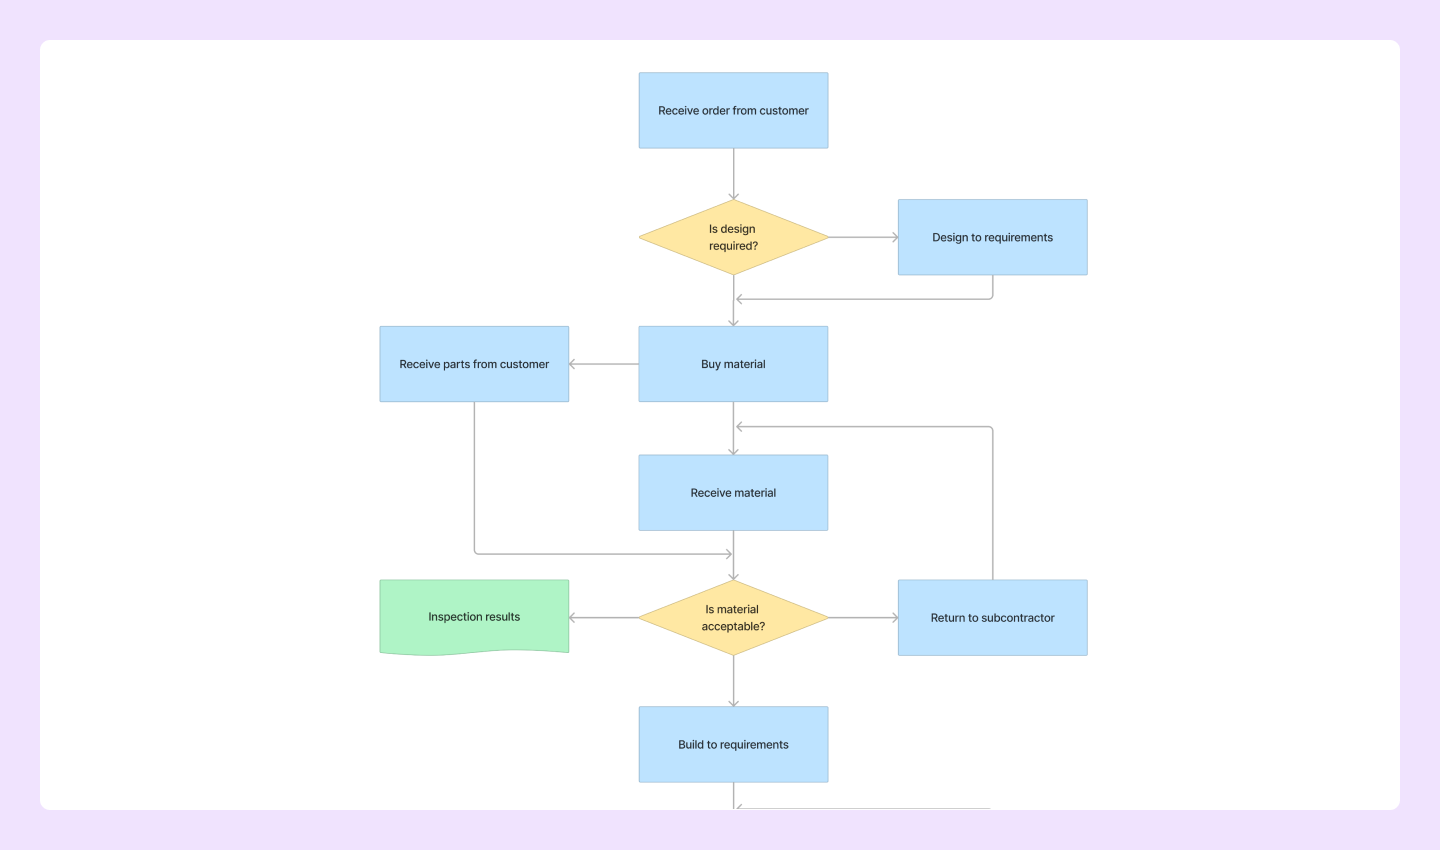
Best for: organizing the steps between customer orders and order deliveries
A production flowchart traces the steps between customer orders and fulfillment. This flowchart highlights the relationship between design work, material production, reviews, and shipping to reveal how a business meets customer demand. Project managers and leaders can use this template to refine core workflows involving an entire business.
Manage orders, production, and deliveries with the production flowchart template.
Type 14: Logical model flowchart

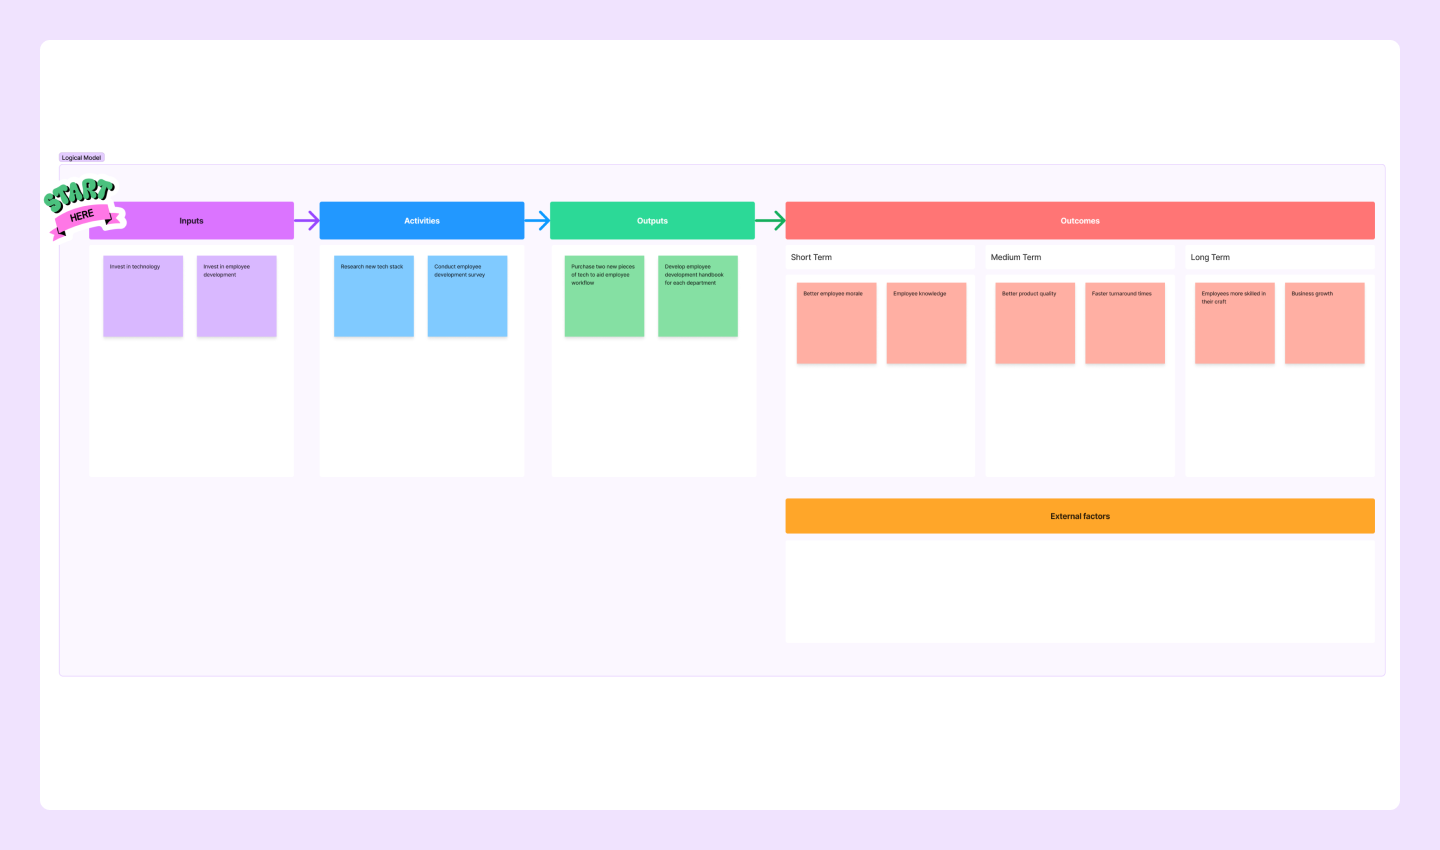
Best for: diagramming the inputs, processes, and outputs leading to process outcomes
A logical model flowchart maps the planning, implementation, and assessment of a business initiative or process. It notes inputs, outputs, and the tasks between them. Beyond documenting operations, logical model charts go a step further to detail the long-term outcomes of the process, highlighting what it tries to accomplish and how well it meets that goal.
Optimize your process outcomes with a logical model flowchart template.
Type 15: Code flowchart

Best for: charting how a program or block of code functions
Code flowcharts diagram the processes within a program or set of code. Like user stories, you can map how user inputs trigger internal processes to produce an output. The diagram also makes room for branching decisions based on a program’s conditions for giving an output. Reviewing the code flow on this chart helps shape tighter, better-performing programs in software development.
Break down complex programs with the code flowchart template.
Type 16: E-commerce flowchart

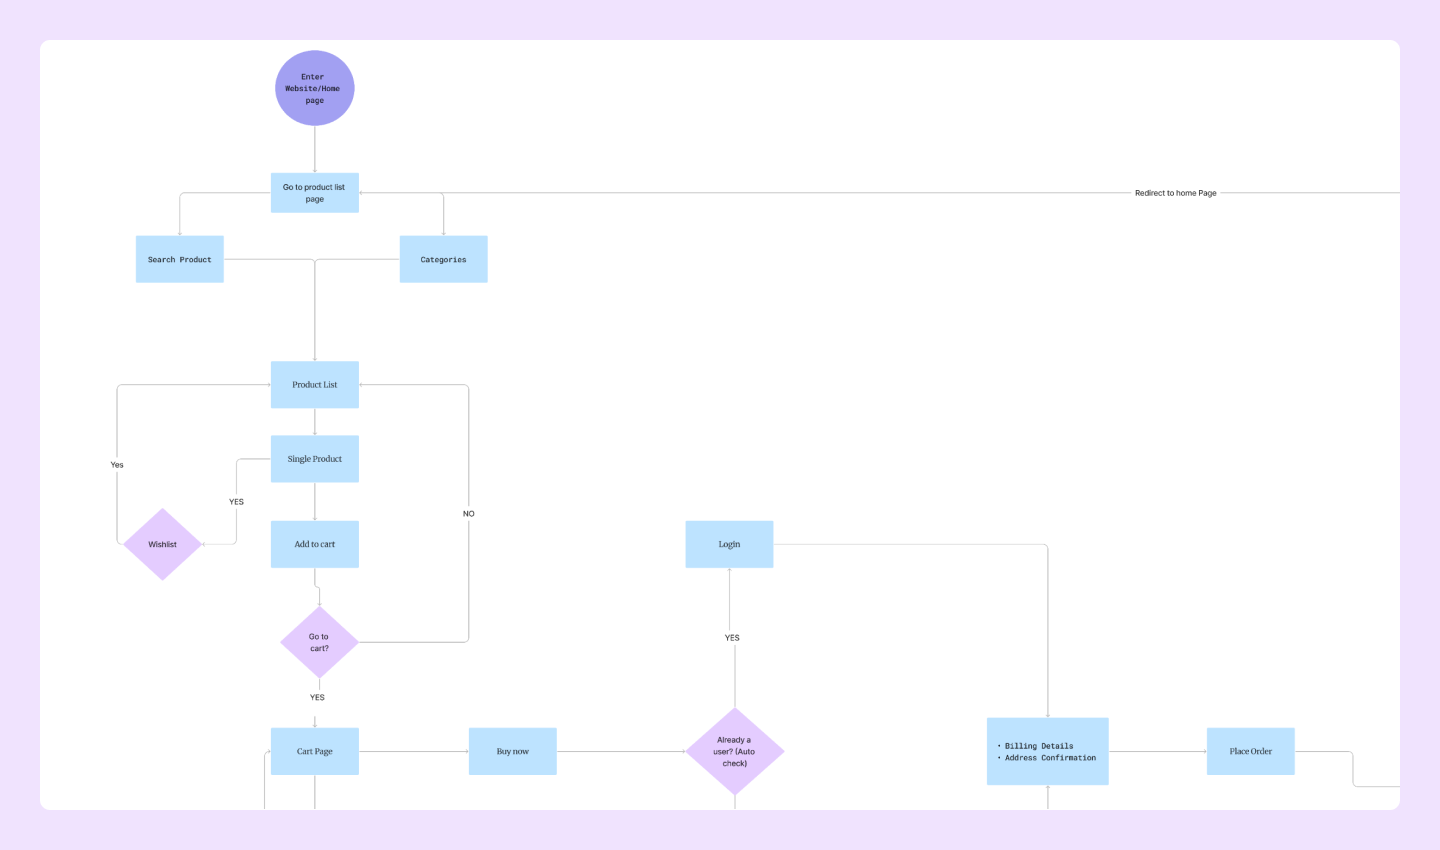
Best for: mapping an e-commerce website’s sales pipeline
E-commerce flowcharts give an overview of your internet sales pipeline. The diagram lets you map your website’s pages and user interactions. You can then adjust how users select items and make purchases to streamline sales and optimize billing processes.
Streamline your online sales process with the e-commerce flowchart template.
Type 17: Website flowchart

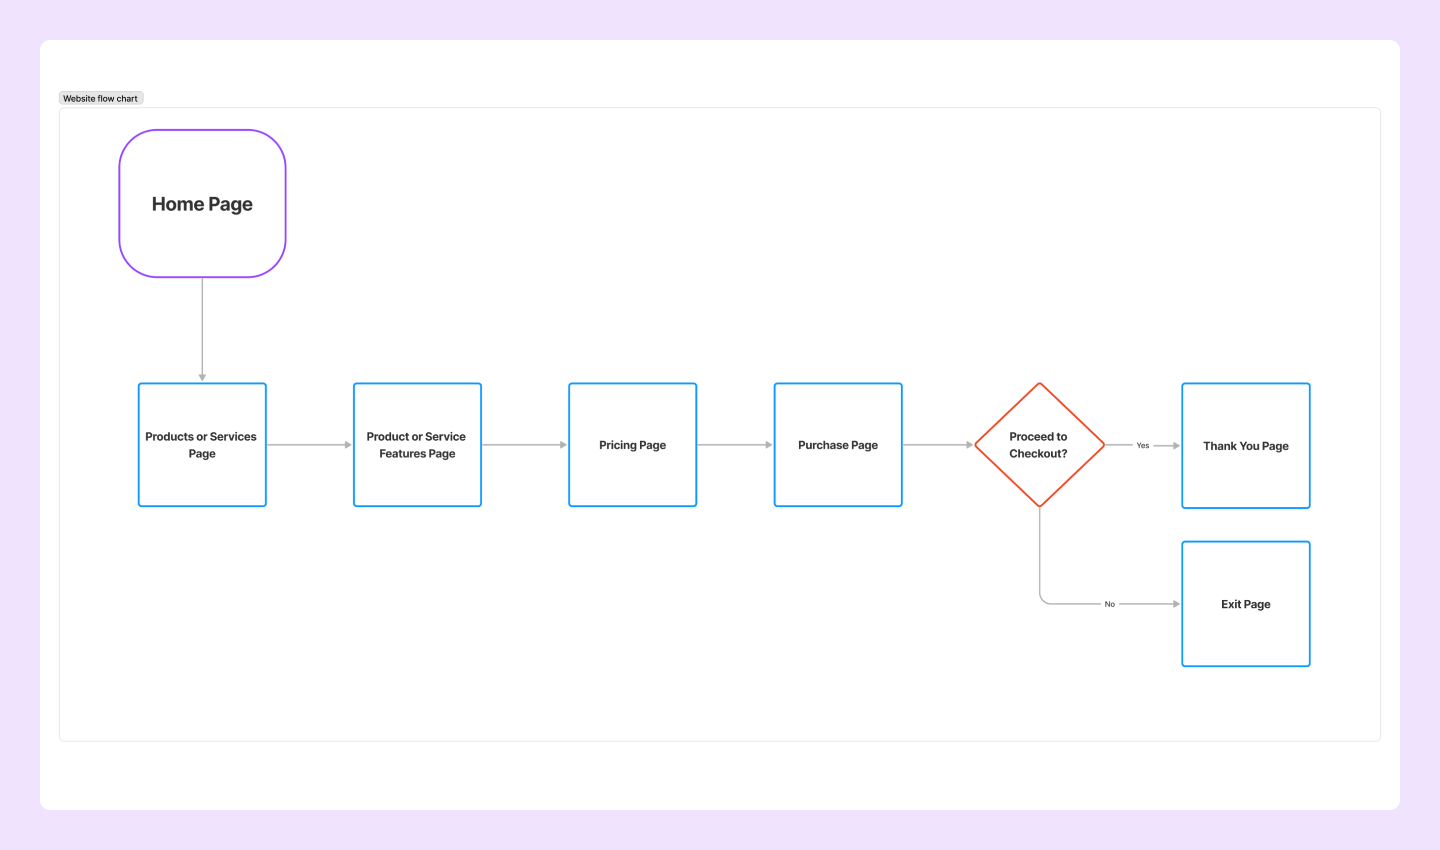
Best for: diagramming website architecture
A website flowchart maps the structure of your web architecture. Designers can review how pages connect and change web structure to improve the user experience. You can also title the boxes to share page names for search engine optimization. This flowchart is a great starting point for teams building a new website or those considering a website redesign.
Improve your web design with the website flowchart template.
5 key characteristics of a flowchart

What are the characteristics of a flowchart?
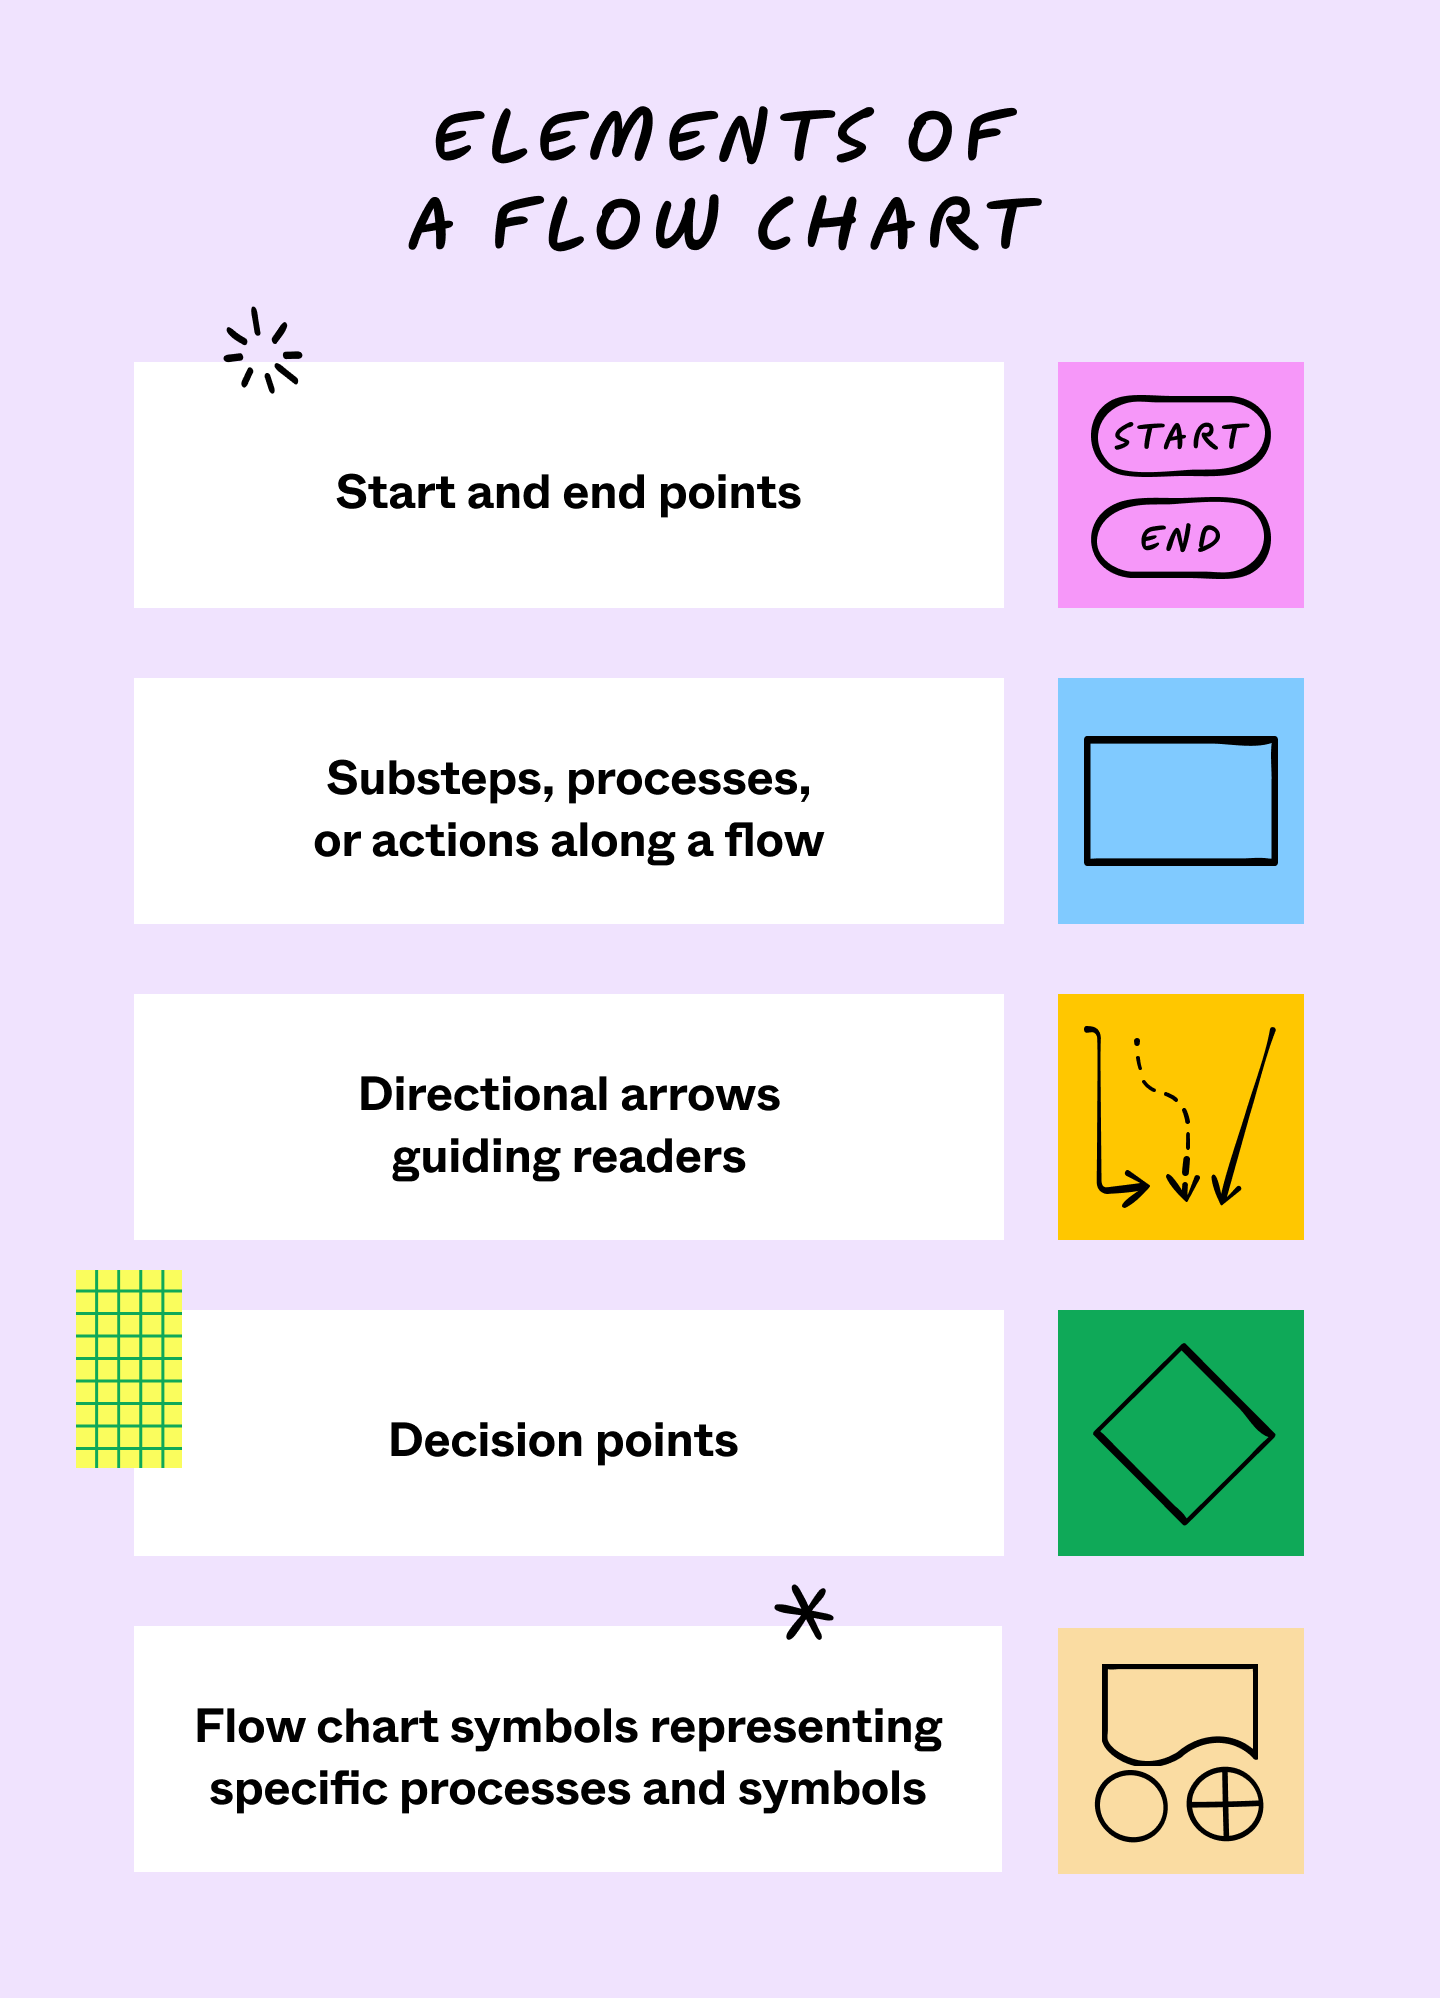
Distinct from mind maps and similar diagrams, every basic flowchart gives a sense of growth and change. Instead of allowing room to brainstorm themes and related ideas, flowcharts focus on illustrating how concepts and workflows progress through different steps. In general, flowcharts include these key elements:
- Start and end points. One or more start and end points linked to a core idea, system, or process.
- Substeps and processes. These guide readers through the entire process or flow, from the beginning to the end.
- Directional arrows. These indicate the sequence of steps, providing a clear, visual order.
- Decision points. Decision points break charts into multiple directions, allowing for different outcomes.
- Flowchart symbols. Standardized flowchart symbols represent specific actions within a system or process.
Flowchart FAQ
Keep reading for answers to frequently asked questions about flowcharts.
What are the four most common types of flowcharts?
The process flowchart, workflow diagram, data flowchart, and swimlane diagram are the most popular types of flowcharts.
When can you use a flowchart?
Teams can use flowcharts to:
- Document complex processes and brainstorm refinements.
- Share how a process or system works with stakeholders and other teams.
- Organize teams for specific tasks in a process.
- Identify bottlenecks and workflow issues.
- Standardize processes, especially in software engineering.
- Check progress during development.
- Outline business process modeling (BPMN), information systems, and manufacturing processes.
What are the rules for flowchart design?
Flowcharts follow specific rules to effectively convey data flow or actions. Keep these guidelines in mind:
- Clearly begin flowcharts at a defined starting point.
- Include endpoints to represent the end of a process or system output.
- Connect flowchart symbols with arrows for clear direction.
- Keep text concise and to the point.
- Ensure the flow of steps follows a logical order.
- Use standardized symbols to prevent confusion.
Collaborate on flowcharts with FigJam
FigJam makes the most of every diagram regardless of the flowchart type you want to use. FigJam is a shared online whiteboard that allows you to seamlessly collaborate at any distance and make new flowcharts on the fly. With FigJam’s flowchart templates, your team can:
- Save time with premade standardized symbols for flowcharts
- Easily share flowcharts with observation and prototyping modes
- Make adjustments to flows and share notes in real time
Are you ready to begin diagramming? Try FigJam to improve collaboration.
Keep reading

What is a UML diagram
UML diagrams can help you plan complex systems and processes.
Learn more

How to create a swimlane diagram
Swimlane diagrams give flowcharts an extra-informative superpower.
Learn more

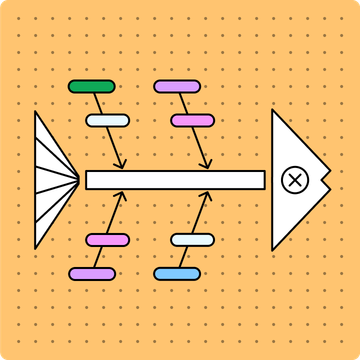
What is a fishbone diagram
Use a fishbone diagram to help you solve problems by understanding what’s causing them.
Learn more