Seismic Anisotropy in Subduction Zones: Evaluating the Role of Chloritoid
 Jungjin Lee
 Mainak Mookherjee
 Taehwan Kim
 Haemyeong Jung
 Reiner Klemd
- 1School of Earth and Environmental Sciences, Seoul National University, Seoul, South Korea
- 2Earth, Ocean and Atmospheric Sciences, Florida State University, Tallahassee, FL, United States
- 3Division of Polar Earth-System Sciences, Korea Polar Research Institute, Incheon, South Korea
- 4Geo-Centre of Northern Bavaria, Friedrich–Alexander University of Erlangen – Nürnberg, Erlangen, Germany
Subduction zones are often characterized by the presence of strong trench-parallel seismic anisotropy and large delay times. Hydrous minerals, owing to their large elastic anisotropy and strong lattice preferred orientations (LPOs), are often invoked to explain these observations. However, the elasticity and the LPO of chloritoid, which is one of such hydrous phases relevant in subduction zone settings, are poorly understood. In this study, we measured the LPO of polycrystalline chloritoid in natural rock samples, obtained the LPO-induced seismic anisotropy, and evaluated the thermodynamic stability field of chloritoid in subduction zones. The LPO of chloritoid aggregates displayed a strong alignment of the [001] axes subnormal to the rock foliation, with a girdle distribution of the [100] axes and the (010) poles subparallel to the foliation. New elasticity data of single-crystal chloritoid showed a strong elastic anisotropy of chloritoid with 47% for S-waves (VS) and 22% for P-waves (VP), respectively. The combination of the LPO and the elastic anisotropy of the chloritoid aggregates produced a strong S-wave anisotropy with a maximum AVS of 18% and a P-wave anisotropy with an AVP of 10%. The role of chloritoid LPO in seismic anisotropy was evaluated in natural rock samples and a hypothetical blueschist. Our results indicate that the strong LPO of chloritoid along the subduction interface and in subducting slabs can influence the trench-parallel seismic anisotropy in subduction zones with “cold” geotherms.
Introduction
Solid-state mantle flow is inferred from seismically observed anisotropy in the upper mantle, in subducting slabs, and in many forearc zones and arc regions. Seismic anisotropy is intricately related to the lattice preferred orientation (LPO) of major mantle minerals (Nicolas and Christensen, 1987; Ben Ismaïl and Mainprice, 1998; Savage, 1999; Karato et al., 2008; Long and Silver, 2008; Jung, 2017). Due to its volumetric abundance in the upper mantle, the LPO of olivine has been extensively studied (Jung and Karato, 2001; Ohuchi et al., 2011; Hansen et al., 2014; Tommasi and Vauchez, 2015; Michibayashi et al., 2016; Skemer and Hansen, 2016; Boneh et al., 2017; Cao et al., 2017; Précigout et al., 2017; Soustelle and Manthilake, 2017). It is well-known that the subducting mantle is variably hydrated, and although olivine is volumetrically the most abundant mineral in subducting slabs, olivine-dominant lithologies alone are often insufficient to provide adequate explanations for the large delay times observed by teleseismic studies (e.g., Katayama et al., 2009; Nagaya et al., 2016). Possible alternative mechanisms suggest that volumetrically less abundant hydrous phases are significantly more elastically anisotropic than major mantle phases (Faccenda et al., 2008; Katayama et al., 2009; Jung, 2011; Mookherjee and Capitani, 2011; Mookherjee and Mainprice, 2014; Kim and Jung, 2015). However, in contrast to olivine, the elasticity and LPOs of volumetrically less abundant hydrous mineral phases are incompletely understood and require further study. The few hydrous minerals like serpentine, amphibole, and chlorite, which have been recently examined, exhibit extreme elastic anisotropy and often a strong LPO (Katayama et al., 2009; Mainprice and Ildefonse, 2009; Jung, 2011, 2017; Puelles et al., 2012; Mookherjee and Mainprice, 2014; Kim and Jung, 2015; Nagaya et al., 2016; Almqvist and Mainprice, 2017; Kang and Jung, 2019; Horn et al., 2020). Chloritoid is such a hydrous phase whose elasticity and LPO remain unknown. Since chloritoid is often found in metamorphosed rocks relevant for subduction zone settings, constraining the elasticity and LPO of chloritoid, it is likely to shed valuable insight on the seismic anisotropy of subduction zones.
Chloritoid [(Mg,Fe)2Al4Si2O10(OH)4] commonly occurs in greenschist to eclogite facies metamorphic rocks with diverse bulk chemistries, including both felsic and mafic rocks (Messiga et al., 1995; Poli and Schmidt, 1997; van Keken et al., 2002; Negulescu et al., 2009). In previous studies of chloritoid-bearing rocks, chloritoid modal amount of 10–23 vol.% has been reported (e.g., Haerinck et al., 2013; Regis et al., 2014). Furthermore, chloritoid is a metamorphic indicator mineral for high- to ultrahigh-pressure metamorphic conditions relevant for subduction zone settings and collision belts (e.g., Kienast and Messiga, 1987; Wei and Song, 2008; Negulescu et al., 2009; Smye et al., 2010; Meyer et al., 2014). The lithologies of subducting hydrated oceanic crust and the overlying high-pressure metapelites are dominated by aluminous minerals such as garnet, lawsonite, epidote, and chloritoid. Among these minerals, the elasticity of chloritoid is virtually unknown. However, a recent X-ray synchrotron diffraction study has explored the bulk preferred orientation of chloritoid in a low-grade metamorphic slate (Haerinck et al., 2015).
In this study, we measured the LPO of chloritoid in schistose rock samples by EBSD analysis and used the results to explore the influence of chloritoid-bearing lithologies on the seismic anisotropy in subduction zone settings. We further re-evaluated the pressure-temperature stability field of chloritoid in subduction zones. In addition, the role of chloritoid in the generation of seismic anisotropy of the slab was examined by comparing its seismic signature with that of other previously studied hydrous minerals, which were found to be stable with chloritoid.
Materials and Methods
Chloritoid-Bearing UHP Rock Samples
The chloritoid-bearing schists studied here come from the Makbal Complex, which is an ultrahigh-pressure (UHP) metamorphic complex located in Kyrgyzstan’s Northern Tianshan orogenic belt (Figure 1 and Supplementary Figure 1). The Makbal Complex is a part of a tectonic mélange and comprises an area of ∼12 × 25 km, in which abundant (U)HP talc-bearing schists are exposed as up to 200 m thick layers in the central zone within the UHP area (ca. 10 km in diameter; Meyer et al., 2014; Lee et al., 2020 and references there in). Previous studies indicate that the Makbal complex protolith represents highly altered oceanic crust, and the equilibrium peak mineral assemblage of chloritoid + garnet + talc + phengite + coesite + rutile revealed peak metamorphic conditions of ∼ 2.85 GPa and 580°C (Meyer et al., 2014). These results imply a subduction up to a depth of 110 km along a cold geotherm, followed by rapid exhumation (Beaumont et al., 2009; Chen et al., 2013; Klemd et al., 2015).
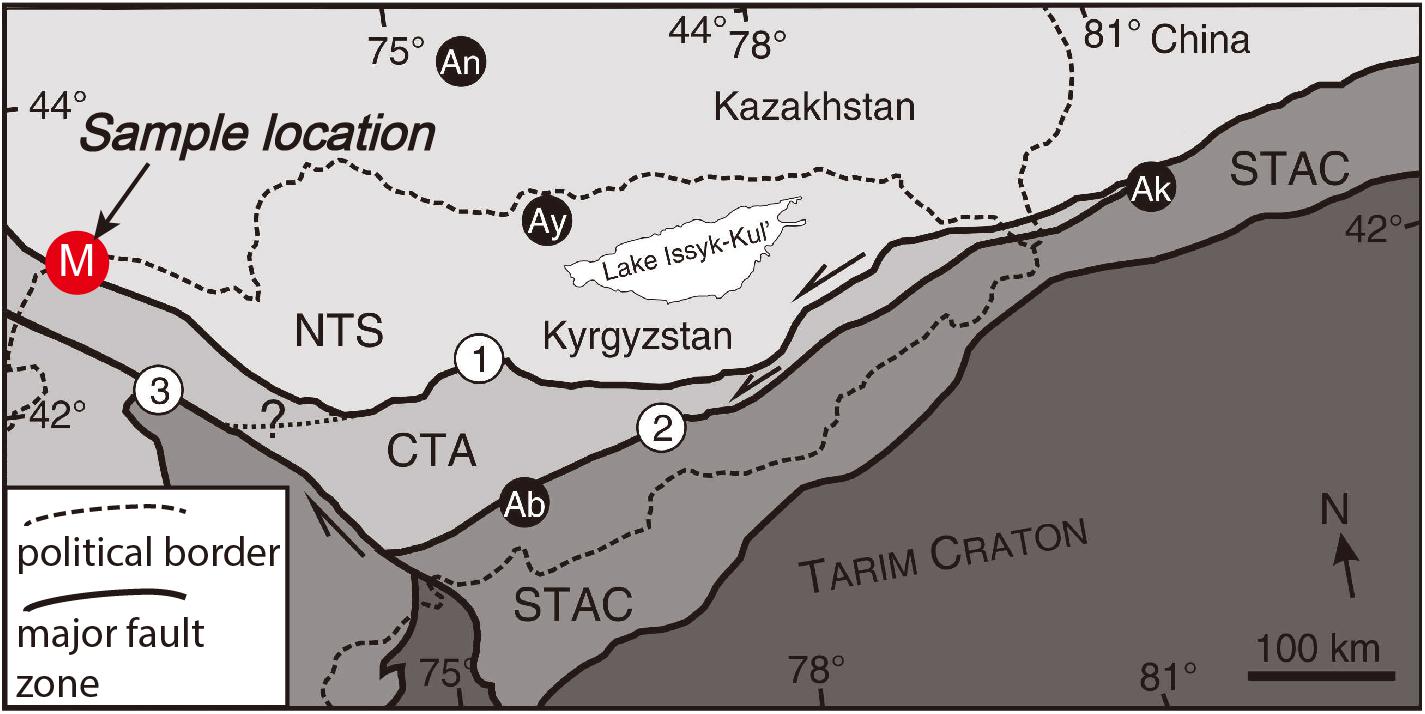
Figure 1. Tectonic sketch map showing the sample location. Major tectonic units are shown (NTS: Northern Tianshan; CTA: Central Tianshan Arc Terrane; STAC: Southern Tianshan Accretionary Complex). Ultra high-pressure metamorphic complexes in the Tianshan orogen are labeled as follows: Makbal (M), Aktyuz (Ay), Atbashi (Ab), and Anrakhai (An) (modified after Meyer et al., 2014).
We selected three garnet-chloritoid-talc schist samples (#15R, #10–16, and #12–52) containing 10–25 vol.% of chloritoid to examine the LPO of chloritoid. The abundance of chloritoid in our samples was similar to that reported from other localities (10–23 vol.%). Additional minerals are phengite, chlorite, quartz, rutile, and minor apatite (Table 1). The strong foliation of talc and phengite defines the schistosity, while the lineation is defined by the average elongation direction of chloritoid, talc, and phengite (Figure 2). Porphyroblastic garnets (5–10 mm in diameter) are embedded in the matrix (Figure 2). Idioblastic chloritoid grains are associated with subidioblastic talc. We measured the chloritoid grain size using the linear intercept method (Gifkins, 1970). Chloritoid is coarse-grained and porphyroblastic in samples #15R (∼500 μm) and #10–16 (∼610 μm), and fine-grained in sample #12–52 (∼150 μm) (Figures 2B,D,F). Equigranular ellipsoidal chloritoid grains are homogeneously distributed in the fine-grained sample (#12–52) (Figure 2F) when compared to the porphyroblastic or clustered occurrence of the coarser-grained chloritoid in samples #15R and #10–16 (Figures 2B,D). Sample #15R is moderately retrogressed, as revealed by the presence of chlorite replacing chloritoid and garnet. Relict euhedral chloritoid grains occur strongly elongated subparallel to the lineation (Figure 2B). The porphyroblastic chloritoid grains of sample #10–16 show internal deformation features such as twinning and undulose extinction (Figure 2D and Supplementary Figure 2). The fine-grained sample #12–52 is characterized by chloritoid grains that lack internal deformation features such as undulose extinction, microkinks, and subgrain boundaries (Figure 2F).
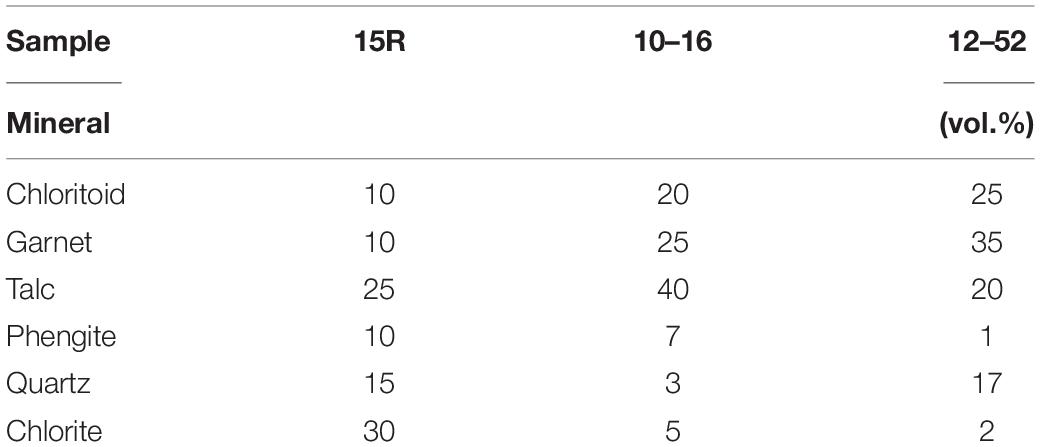
Table 1. Modal composition (in vol.%) of the samples.
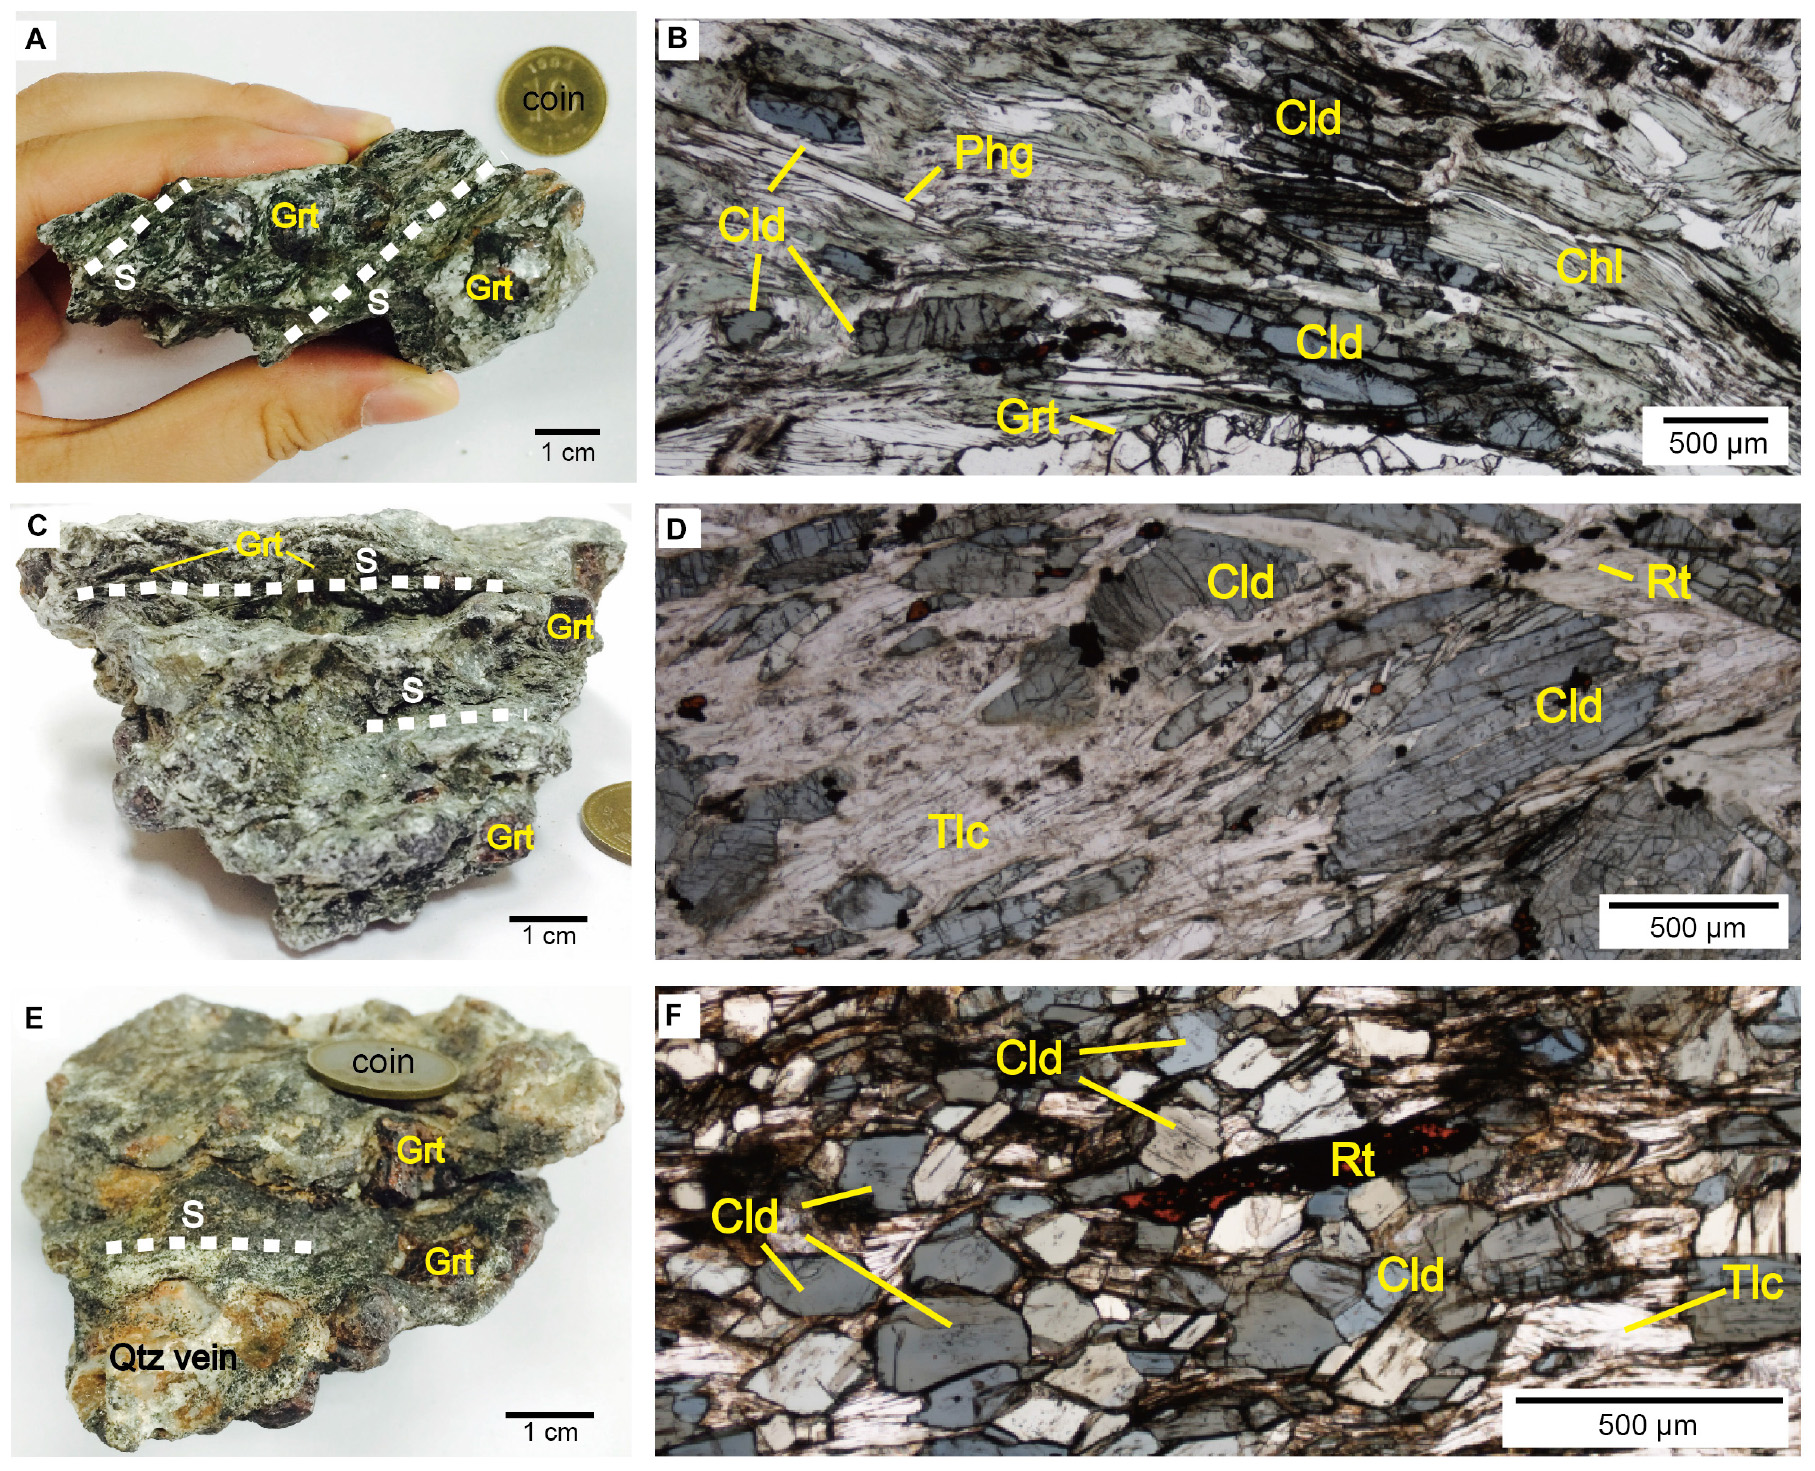
Figure 2. Hand specimen (A,C,E) and plane-polarized microphotographs (B,D,F) of UHP Makbal garnet-chloritoid-talc schist samples. (A,B) sample #15R, (C,D) sample #10–16, (E,F) sample #12–52. In hand specimen, dashed lines denote the well-developed foliation (S). The lineation was determined on the foliation, by averaging directions of elongation of chloritoid and talc, and here parallel to the horizontal scale bar shown. Grt, garnet; Qtz, quartz; Cld, chloritoid; Tlc, talc; Rt, rutile.
Measurement of the LPO
We determined the foliation by examining the compositional layering of talc and phengite, and the lineation by the elongation of chloritoid and layered minerals along the foliation plane. Thin sections were prepared along the X-Z plane, where X is parallel to the lineation and Z is normal to the foliation, and mechanically and chemically polished using Syton colloidal silica. The LPO of chloritoid was measured using electron-backscattered diffraction (EBSD) with a JEOL JSM-6380 scanning electron microscope (SEM) located in the School of Earth and Environmental Sciences at Seoul National University. The SEM was operated using an accelerating voltage of 20 kV, a vacuum level of chamber of 9.6 × 10⁻⁵ Pa, 1-nA current, 5-μm beam size, and a working distance of 15 mm. All thin sections were carbon coated. To avoid repeated data collection, we indexed the EBSD patterns manually for every single grain. For a better data quality, the LPO of chloritoid was measured with a mean angular deviation of less than 1.0° and a minimum of 11 diffraction Kikuchi bands for each point measurement. A monoclinic instead of a triclinic space group symmetry of the chloritoid was used for the analysis, because the detected Kikuchi bands closely matched the simulated Kikuchi bands of the monoclinic chloritoid.
The chloritoid LPOs in the Grt-Cld-Tlc schist samples were plotted using the MATLAB toolbox MTEX, version 5.4.0 (Mainprice et al., 2011). For plotting the LPO, the orientation distribution functions of the chloritoids were calculated using a de la Vallée Poussin kernel with half widths of 10°. The strength of the LPO was quantified by the J-index (Bunge, 1982) and M-index (Skemer et al., 2005).
Elasticity of Chloritoid
We performed first principles simulations based on the density functional theory (Hohenberg and Kohn, 1964; Kohn and Sham, 1965). The chloritoid was investigated with a widely used approximation of the exchange-correlation functionals—the local density approximation (LDA) and the generalized gradient approximation (GGA) with the highly accurate projector augmented wave (PAW) method as implemented in the Vienna ab initio simulation package (VASP) (Kresse and Joubert, 1999). We used the monoclinic (C2/c space group) crystal structure (Comodi et al., 1992) with a Mg2Al4Si2O10(OH)4 stoichiometry and performed a series of convergence tests by varying the energy cut-off and k-points. An observed energy cut-off of Ecut–off = 900 eV and a k-point mesh of the 2 × 4 × 1 Monkhorst-Pack grid (Monkhorst and Pack, 1976) with six irreducible k-points were sufficient for describing the energetics of chloritoid. In order to determine the full elastic constant tensor, the lattice parameters were strained by 0.5, 1.0, and 1.5% for one static volume, and we observed that an appropriate ∼1% strain is within the elastic limit (e.g., Chheda et al., 2014). The elastic stiffness constants (Cijs) for monoclinic magnesiochloritoid, calculated using the GGA and LDA methods, are reported in Table 2.
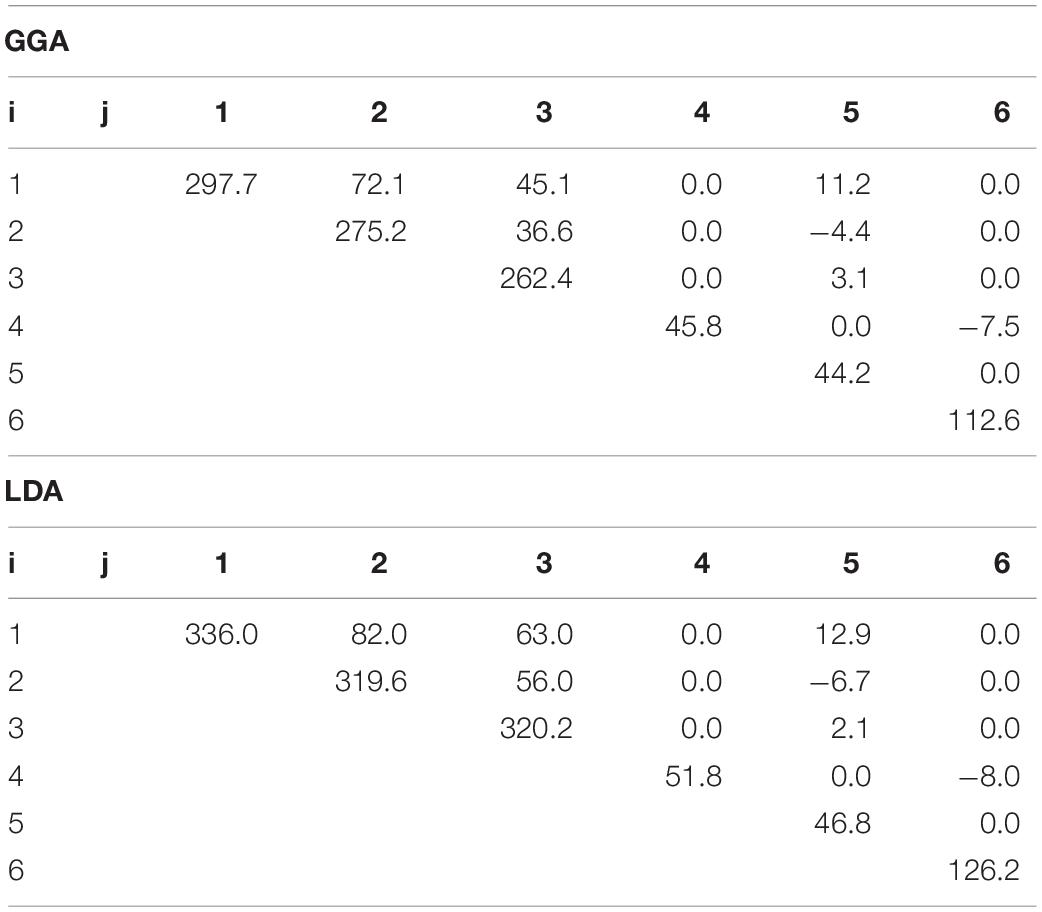
Table 2. Elastic stiffness tensor (Cij in GPa) of single crystal chloritoid using the GGA method (P = 0 GPa, density = 3.10 g/cm3) and the LDA method (P = 0 GPa, density = 3.30 g/cm3).
Calculation of the Seismic Velocity and Anisotropy
The seismic anisotropy of single-crystal chloritoid and that of polycrystalline chloritoid were obtained with the MSAT toolkit (Walker and Wookey, 2012), using elastic constants determined in this study. We determined the elastic constants at ambient pressures (P = 0 GPa) using first principles with both the GGA and the LDA. The zero-pressure density predicted using the LDA of ∼ 3.30 gcm–3 is larger than that using the GGA of ∼ 3.10 gcm–3. Also, the elastic constants predicted using the LDA are stiffer than that of using the GGA (Table 2). This difference between the GGA and the LDA results is expected and has already been reported for other hydrous mineral assemblages (Mookherjee and Bezacier, 2012; Peng and Mookherjee, 2020). We observed that the aggregate bulk moduli for the GGA are in better agreement with the experimental estimates of the bulk modulus (Grevel et al., 2005).
The seismic velocities (VP and VS) were calculated with the Christoffel equation (e.g., Mainprice et al., 2008). A plot of the elastic anisotropies of the single-crystal chloritoid is presented in Figure 4. The P-wave anisotropy (AVP) for the mineral aggregates was calculated as:
where VPmax refers to the maximum P-wave velocity (VP) and VPmin refers to the minimum P-wave velocity (VP). The S-wave anisotropy for the mineral aggregates (AVS) is defined as
using the Voigt–Reuss–Hill averaging scheme, where the VS1 and VS2 represent the fast and slow S-wave velocity, respectively (Mainprice, 1990). The seismic anisotropies of the chloritoid aggregates were calculated with the Cij values determined in this study using the GGA (Figures 4, 5). We calculated the seismic properties of other hydrous minerals in the Grt-Cld-Tlc schists, using the single-crystal elastic constants (Cij) of chloritoid (this study), chlorite (Mookherjee and Mainprice, 2014), and for phengitic mica, we used the elastic constants of muscovite (Vaughan and Guggenheim, 1986). For consistency, ambient-pressure elastic constants were used for all minerals. To calculate the bulk seismic anisotropy of the Grt-Cld-Tlc schist and a hypothetical blueschist (detailed in section “Effect of Hydrous Minerals in Blueschist-Facies Rock on Seismic Anisotropy”), the elastic constants of the composite minerals were averaged using the Voigt–Reuss–Hill scheme and the modal compositions (see Table 1 and captions of Table 3).
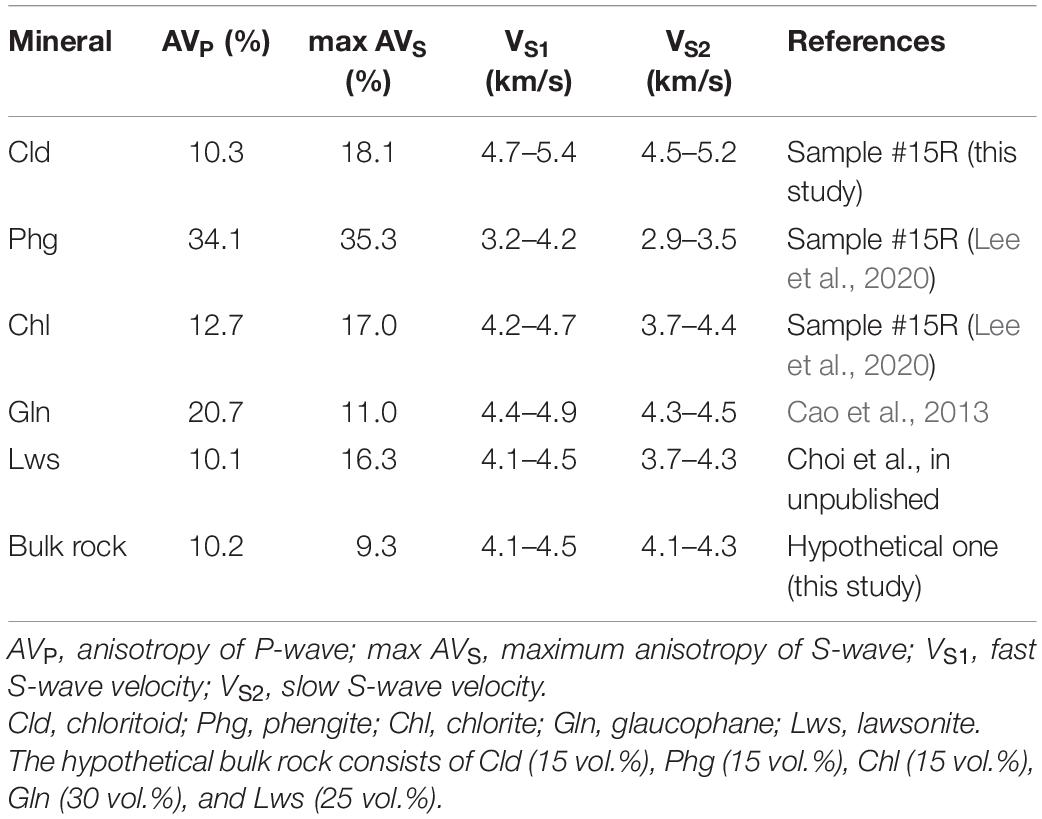
Table 3. Seismic velocity and anisotropy of hydrous minerals and a hypothetical bulk rock.
Calculation of the Thermodynamic Stability and Modal Abundance of Chloritoid
We used thermodynamic calculations to obtain the equilibrium pressure–temperature (P–T) stability field for chloritoid, commonly referred to as pseudosections. In addition, we determined the modal abundance (i.e., volume percentage of chloritoid as a function of pressure and temperature) in the different pseudosections calculated in this study. The bulk compositions of three different rock types were considered: (1) Grt-Cld-Tlc schist (this study), (2) average pelite (Shaw, 1956) (Supplementary Figure 3), and (3) aluminous metagabbro (Messiga et al., 1999) (Supplementary Figure 4). For the Grt-Cld-Tlc schist, the effective bulk rock composition of sample #10–16 was used (Meyer et al., 2014). The Theriak-Domino thermodynamic software (de Capitani and Petrakakis, 2010) and the recent version of the Holland and Powell (2011) thermodynamic dataset was used to calculate the P–T pseudosections in the CaO-K2O-FeO-MgO-Al2O3-SiO2-H2O (CKFMASH) and Na2O-CaO-K2O-FeO-MgO-Al2O3-SiO2-H2O (NCKFMASH) model systems with activity models for chloritoid (White et al., 2000), garnet (White et al., 2007), clinopyroxene (Green et al., 2007), amphibole (Diener and Powell, 2012), talc (Holland and Powell, 1998), white mica (Coggon and Holland, 2002), chlorite (Holland et al., 1998), and feldspar (Baldwin et al., 2005). Pure end-member mineral phases include lawsonite, kyanite, quartz/coesite, and water, which was set to be in excess, i.e., all the reactions were considered at water saturated conditions. The P–T range of each pseudosection covers 1.0–3.5 GPa and 450–650°C.
Results
LPOs of Chloritoid
The chloritoid LPOs are all characterized by a strong alignment of the [001] axes subnormal to the foliation (Figure 3). The strongest chloritoid LPO in sample #15R is characterized by the concentration maxima of the [100] axes subparallel to the foliation and subnormal to the lineation, and by the (010) poles subparallel to the lineation. The chloritoid LPO in sample #15R exhibits high J-index (11.16) and M-index (0.17). In samples #10–16 and #12–52, chloritoid showed a weak LPO of the [001] axes subnormal to the foliation and a weak girdle distribution of the [100] axes and (010) poles subparallel to the foliation. The chloritoid LPO of samples #10–16 and #12–52 showed relatively low J-indices (5.90 and 3.31) and M-indices (0.07 and 0.08).
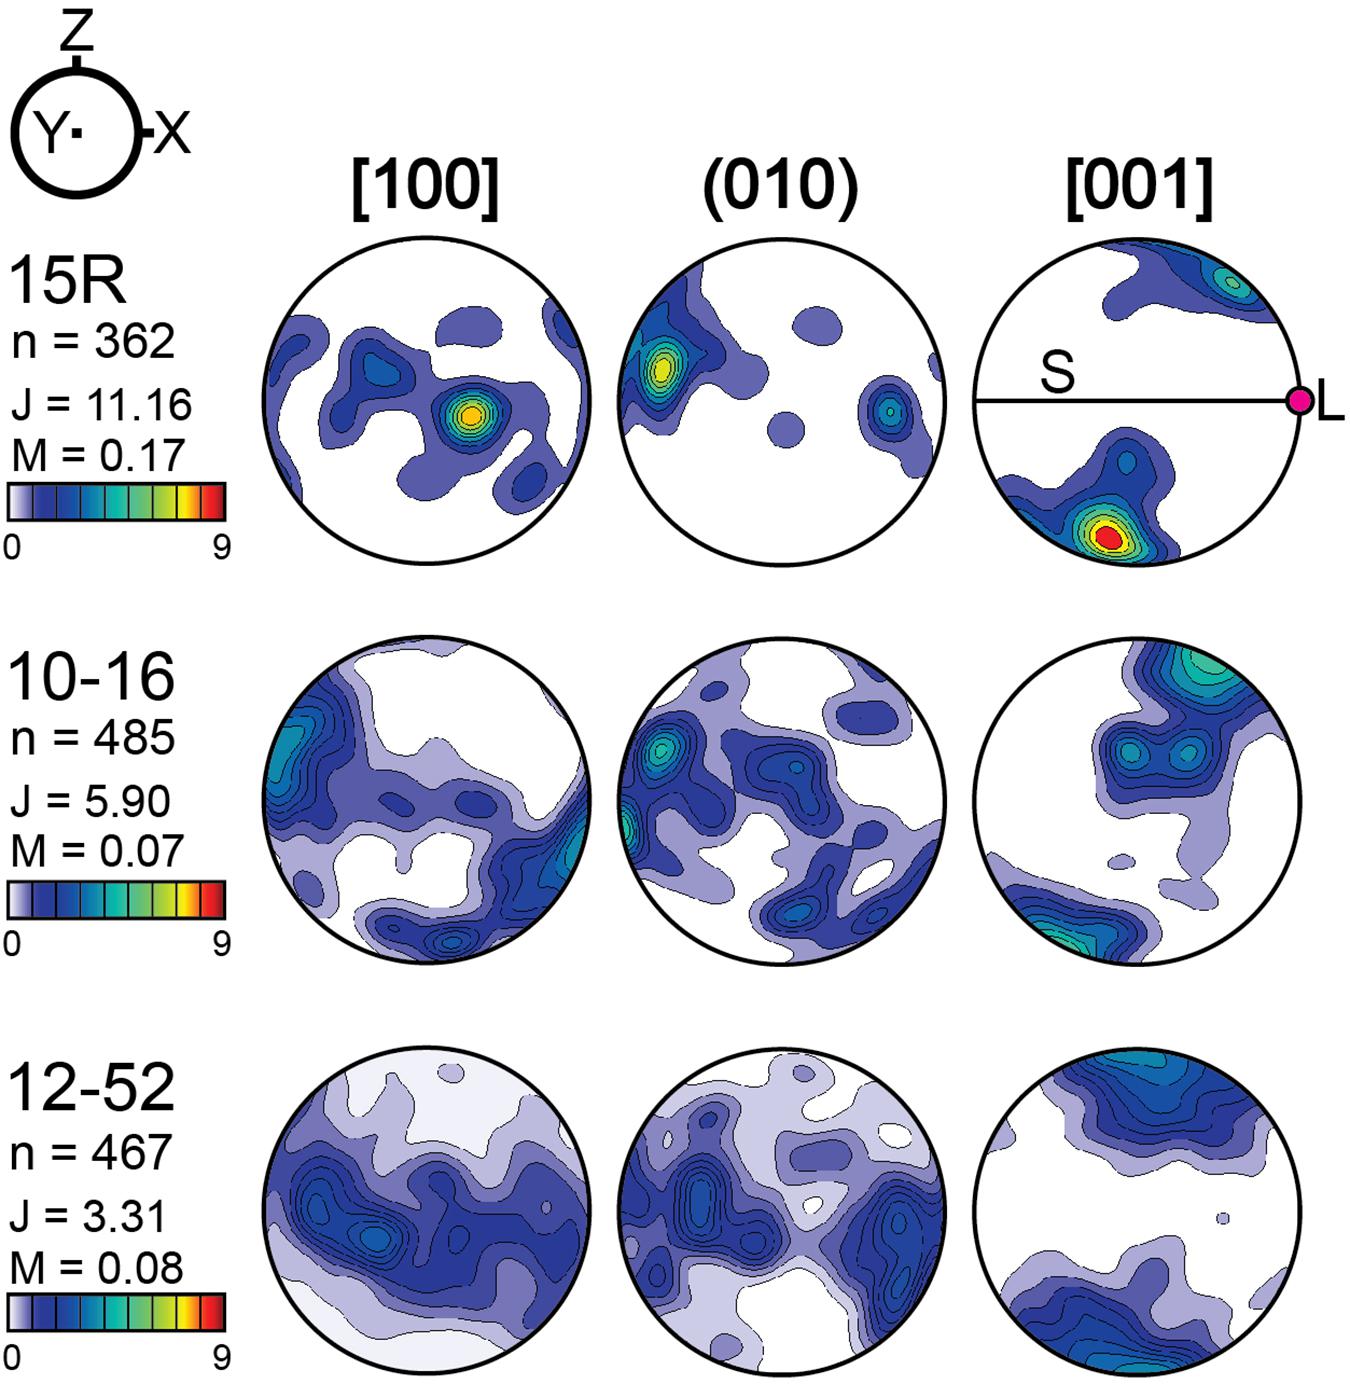
Figure 3. Pole figures showing the LPO of chloritoid in the three UHP Makbal schist samples. Pole figures are presented in the lower hemisphere using an equal area projection. Pole figure density is shown with colorbar in units of multiples of a random distribution. Fabric strengths are also presented as J-index (J) and M-index (M). The X-direction is parallel to the lineation (L), Z-direction normal to the foliation (S), and the Y-direction orthogonal to the X- and Z-direction. To the left of the pole figures, n represents the number of the analyzed grains.
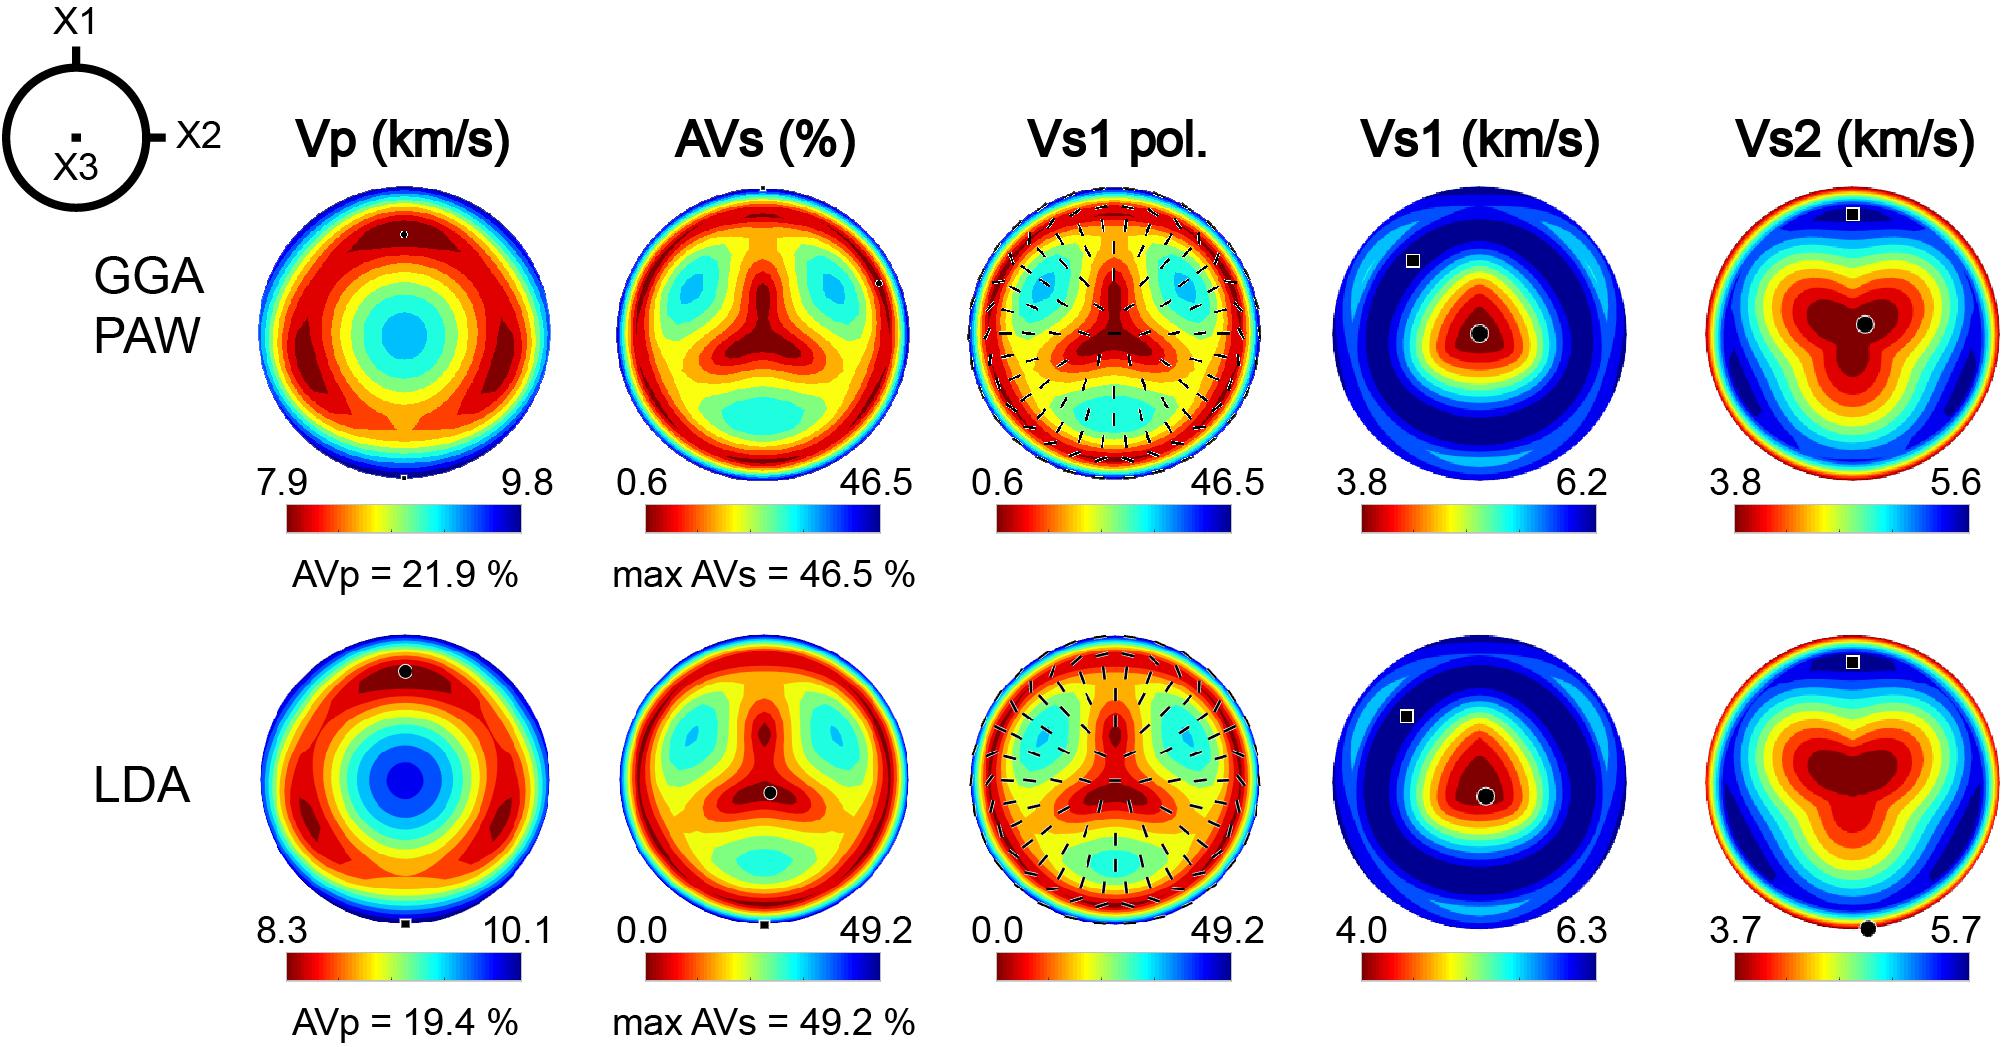
Figure 4. Elastic anisotropy of single-crystal monoclinic chloritoid at a pressure of 0 GPa. The P-wave anisotropy was high (AVP = 21.9 and 19.4% for the GGA PAW and LDA methods, respectively) and the shear wave anisotropy was very high (max AVS = 46.5 and 49.2% for the GGA PAW and LDA methods, respectively). The polarization directions of the fast shear wave (VS1 polarized) are shown as black bars. A reference frame for monoclinic symmetry is shown on the left and depicts three orthogonal axes X1, X2, and X3, where X2 is parallel to the crystallographic b-axis and the plane normal to the b-axis is a mirror plane containing X1 and X3 (where X1 corresponds to the reciprocal a*-axis and X3 is parallel to the crystallographic c-axis). VP, P-wave velocity; AVS, shear wave anisotropy; VS1 pol, polarization direction of the fast S-wave; VS1, fast S-wave velocity; VS2, slow S-wave velocity.
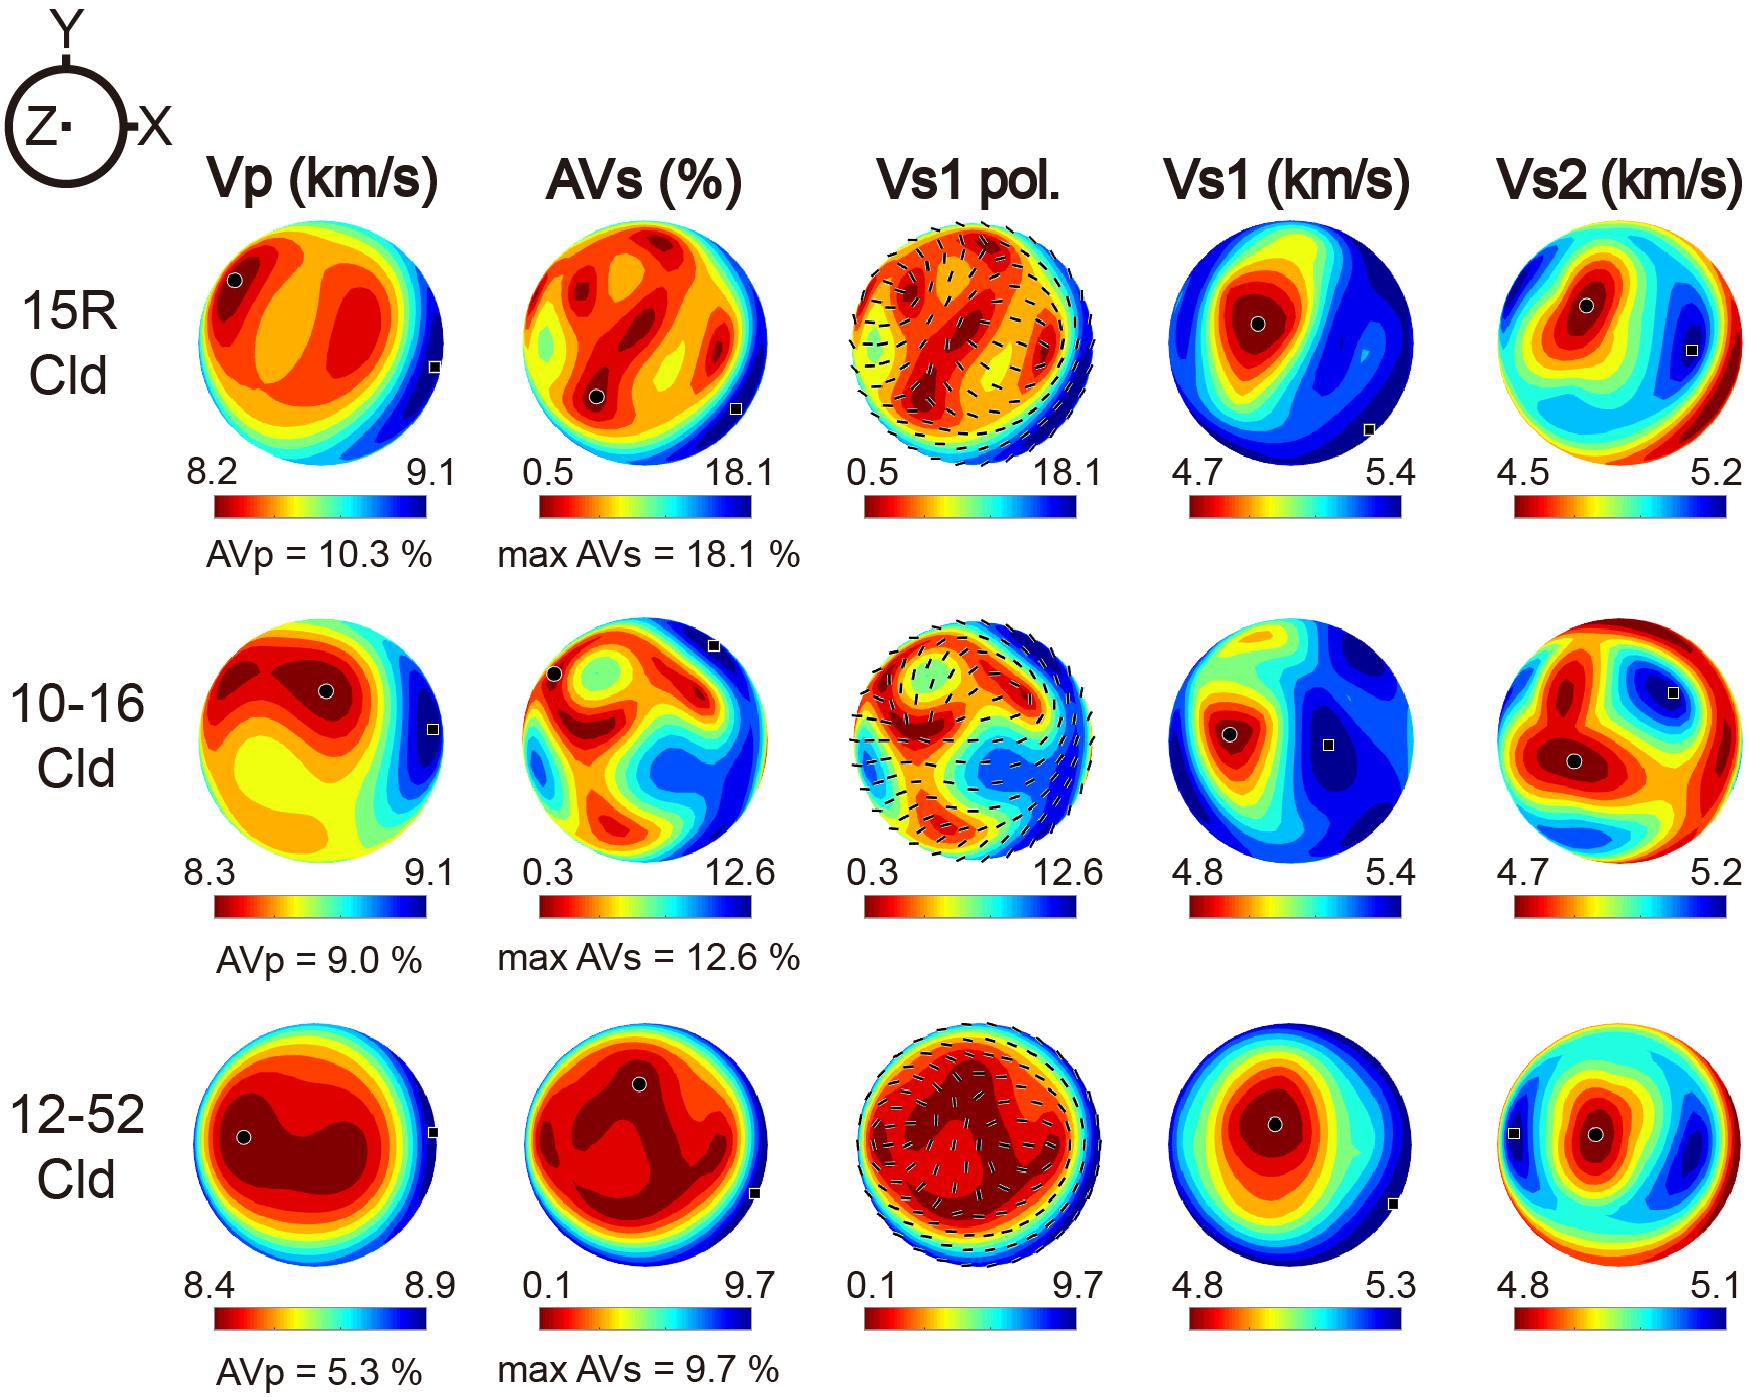
Figure 5. Seismic anisotropies of polycrystalline chloritoid in the UHP Makbal schist samples. The elastic anisotropy using GGA method (Figure 4) was applied to the calculation (see “Materials and Methods” section). The P-wave anisotropy is up to AVP = 10.3% (sample #15R), and the S-wave anisotropy is up to AVS = 18.1% (sample #15R). The anisotropy is shown on a stereonet, in which the center of a plot (Z) represents the direction normal to the foliation (X-Y plane), and X corresponds to the lineation. VP, P-wave velocity; AVS, shear wave anisotropy; VS1 pol, polarization direction of the fast S-wave; VS1, fast S-wave velocity; VS2, slow S-wave velocity.
Elastic Constant and Seismic Anisotropy of Chloritoid
The elastic anisotropy of the single-crystal chloritoid was calculated by using the elastic constant (Cij) obtained by first principles simulation at ambient pressure conditions (P = 0 GPa) (Table 2 and Figure 4). The elastic constants show a similar anisotropy of stiffness components between the directions normal to the c-axis (C11, C22) and the c-axis direction (C33), and a strong anisotropy observed among the shear elastic components, i.e., C66≫C44∼C55 (Table 2). The seismic velocities and seismic anisotropies of the single-crystal chloritoid for a given propagation direction were calculated from the Cij, the contoured stereograms of the P-wave velocity (VP), the percentage shear wave anisotropy (AVS), and the polarization directions of the fastest S-wave (VS1 pol.) for ambient pressures (Figure 4). The pattern of the VP showed high velocities (maximum VP = 9.8 km/s) normal to the c-axis, and low velocities (minimum VP = 7.9 km/s) oblique to the c-axis, displaying a high seismic P-wave anisotropy (AVP = 21.9 and 19.4% for the GGA and LDA, respectively). The AVS normal to the c-axis exhibits maximum AVS = 46.5 and 49.2% for the GGA and LDA, respectively. The AVS parallel to the c-axis exhibits a minimum AVS of 0.6 and 0.1% for the GGA and LDA, respectively. The fast S-wave has a polarization in the basal plane, which is typical for layered silicates (e.g., Morales et al., 2013). However, the elastic constants predicted by the LDA are stiffer than those using the GGA, while the elastic anisotropies predicted by the GGA and LDA are similar (Figure 4 and Table 2).
The seismic anisotropies of the P- and S-waves of the polycrystalline chloritoid were calculated (Figure 5) by using the elastic stiffness constant (Table 2) and the LPOs of chloritoid (Figure 3). The magnitudes of the seismic anisotropies of the polycrystalline chloritoid are large (up to AVP = 10.3%) for the P-waves (sample #15R) and larger (up to AVS = 18.1%) for the S-waves (sample #15R) (Figure 5). The seismic anisotropy of the S-waves is high at angles shallow to the foliation and at a maximum subparallel to the lineation (flow direction) (samples #15R and #10–16), where the polarization direction of the fast S-wave (VS1) is nearly perpendicular to the lineation (X-direction).
The fast S-wave polarization direction of the chloritoid strongly depends on the wave propagation direction (Figure 5). As the ray path proceeds far-off the Z-direction and close to the direction parallel to the foliation, the polarization direction varies from oblique to nearly perpendicular to the rock lineation (X) (Figure 5).
The bulk rock seismic anisotropies of the three Grt-Cld-Tlc schist samples were estimated (Supplementary Figure 5) by averaging the elastic constant of the mineral aggregate, considering the LPOs of the chloritoid and other composite minerals (such as garnet and talc), their individual single-crystal elastic constant, the densities of the individual phases, and the modal volume percentages of the sample (Table 1). The magnitudes of the whole-rock seismic anisotropies were found to be very large for the P-waves (up to AVP = 28.1%) and large for the S-waves (up to AVS = 15.5%). For all three Grt-Cld-Tlc schist samples, the entire rock AVP (AVP = 14.7–28.1%) is higher than that of the chloritoid aggregates (AVP = 5.3–10.3%). On the other hand, the maximum whole rock AVS of samples #15R and #12–52 (max AVS = 15.5 and 7.0%, respectively) is lower than that of the chloritoid aggregates (max AVS = 18.1 and 9.7%, respectively). The maximum whole rock AVS (max AVS = 14.5%) of sample #10–16 is higher than that of the chloritoid aggregates (max AVS = 12.6%). The pattern of the VS1 polarization direction of the bulk rocks is very similar to that of the chloritoid aggregates.
Thermodynamic Stability and Modal Abundance of Chloritoid
The P-T pseudosection of the Grt-Cld-Tlc schist (sample #10–16) calculated in this study shows that chloritoid is thermodynamically stable in the temperature range of 450–600°C (Figure 6A). The modal abundance of chloritoid was calculated for the three different bulk compositions (Figure 6B and Supplementary Figures 3B, 4B). The calculations for the Grt-Cld-Tlc schist revealed that the highest amount of chloritoid was 28 vol.% within the given P–T conditions, which is in good agreement with the observed amount of chloritoid in the samples studied here (20–25 vol.% in samples #10–16 and #12–52) (Figure 6B). The possible modal amounts of chloritoid in the average pelite (Shaw, 1956) and the Mg-Al metagabbro (Messiga et al., 1999) are up to 20 and 22 vol.%, respectively. The variation of the chloritoid modal volume shows the development of a complex pattern during pressure increase in all three rock types. Along cold subduction geotherms (5–10°C/km), the maximum chloritoid amount reaches 26 vol.% (Figure 6B) and is highest above the chlorite-out reactions in the Grt-Cld-Tlc schist (Figure 6). In the Grt-Cld-Tlc schist, chloritoid is stable at <600°C, and its amount generally decreases with increasing P–T conditions (Figure 6). Other hydrous minerals stable with chloritoid are chlorite, lawsonite, talc, mica, Mg-carpholite, and zoisite. When considering the average pelitic composition, the stability field of chloritoid is constrained to be at >1.5 GPa and <580°C (Supplementary Figure 3). Hydrous minerals stable with chloritoid are chlorite, glaucophane, lawsonite, mica, and carpholite. When considering the Mg-Al gabbro composition, chloritoid occurs at relatively high P-T conditions (>2 GPa and >570°C) (Supplementary Figure 4). Other hydrous minerals stable with chloritoid are chlorite, glaucophane, lawsonite, and zoisite.
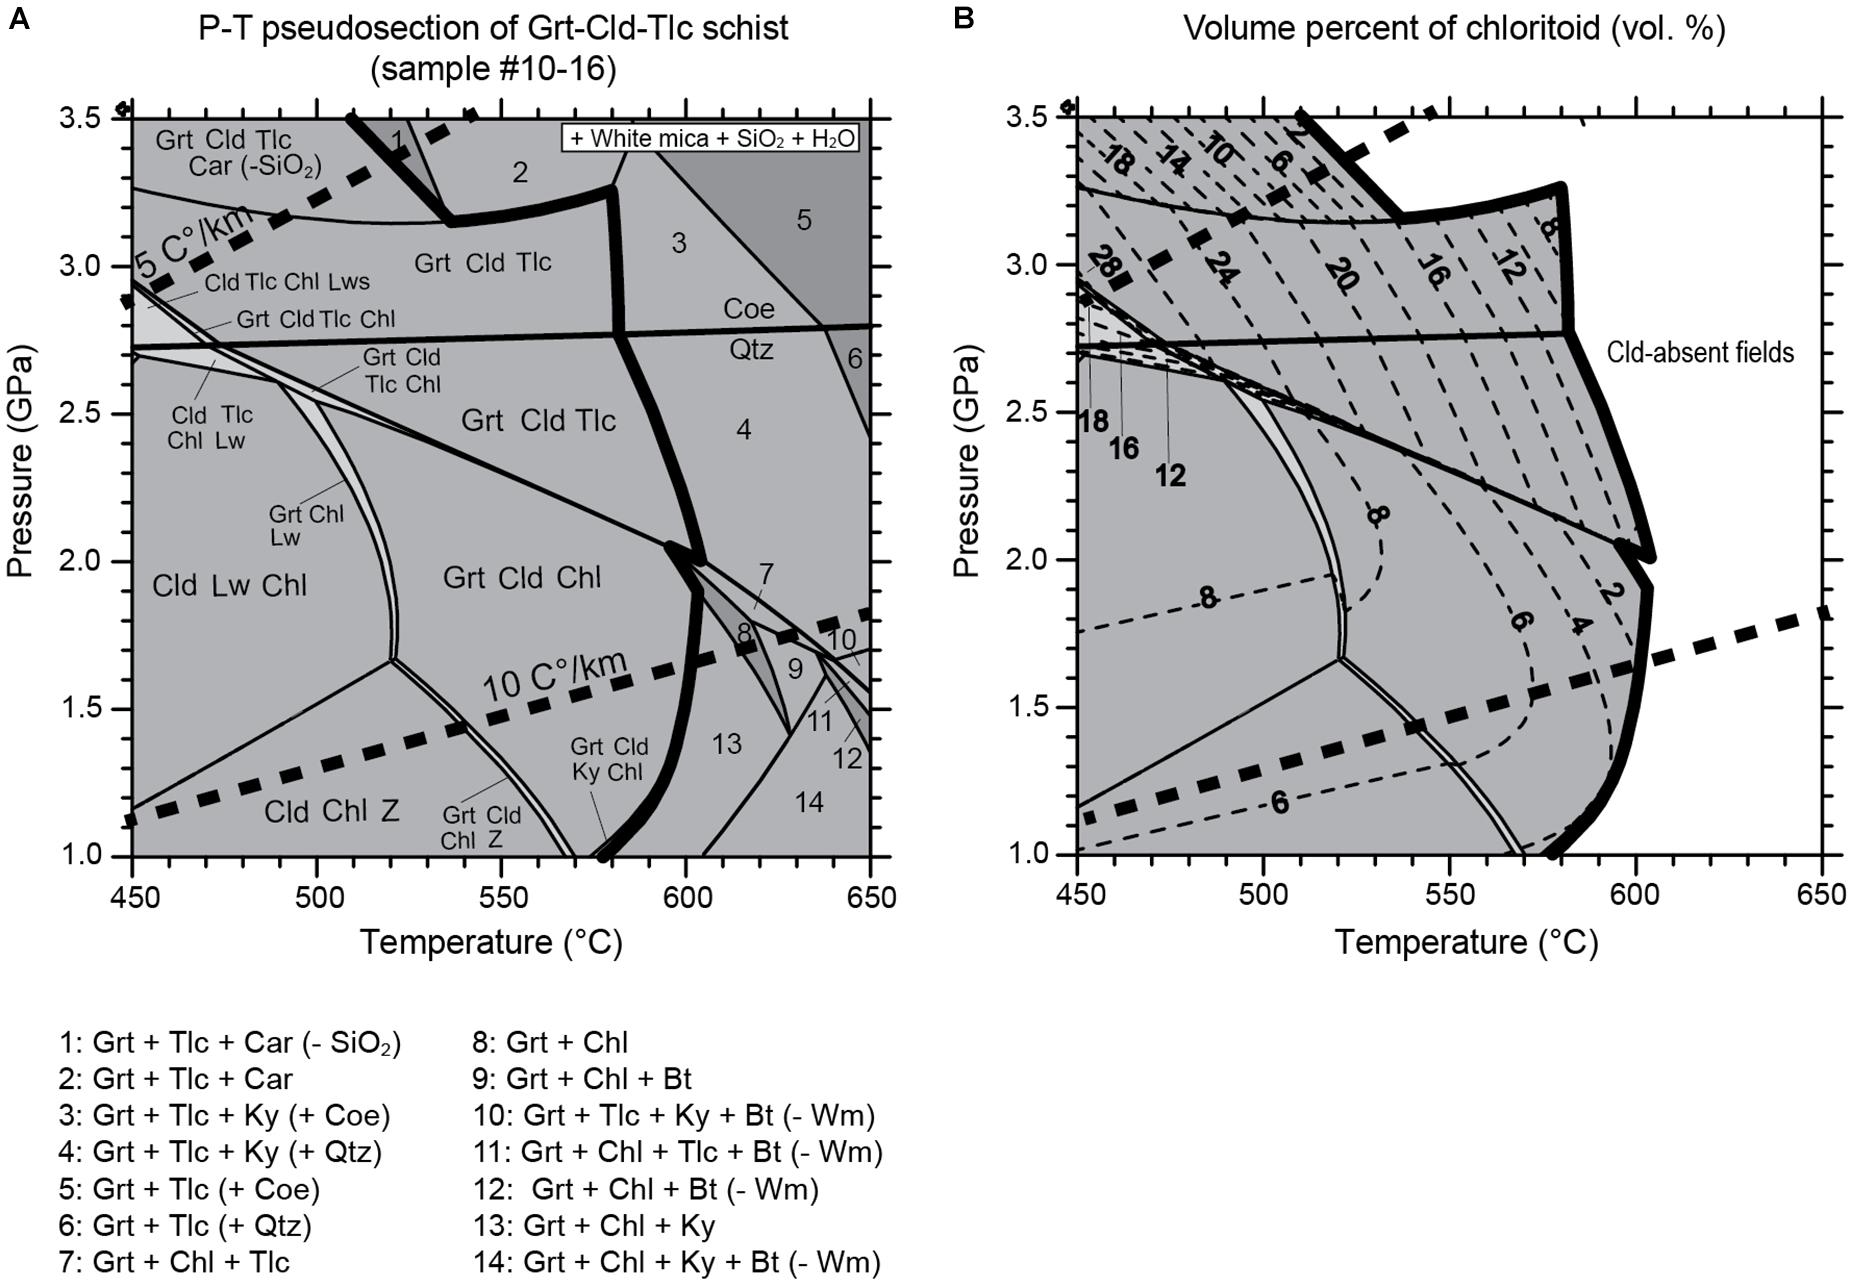
Figure 6. P–T pseudosection showing the chloritoid-stability fields and the volume percentage isopleths of chloritoid. (A) P–T pseudosection calculated for the Grt-Cld-Tlc schist (sample #10–16) in the model system CKFMASH. Bulk composition in mol%: SiO2, 49.0; Al2O3, 11.0; FeO, 17.0; MgO, 22.5; CaO, 0.2; K2O, 0.2; H2O is excess. Dashed bold lines denote the geothermal gradients of 5 and 10°C/km, respectively. Chloritoid-out curve is indicated by solid bold line. Mineral abbreviation: Grt, garnet; Cld, chloritoid; Tlc, talc; Chl, chlorite; Wm, white mica; Bt, biotite; Lw, lawsonite; Ky, kyanite; Car, carpholite; Z, zoisite. (B) Volume percentage isopleths of chloritoid. The geothermal gradients are the same as in (A).
Discussion
LPO Development of Chloritoid
A strong alignment of the [001] axes of the chloritoid was observed in the UHP schist samples from the Makbal Complex. This is consistent with findings of Haerinck et al. (2015), although they used a different analyzing method for the fabric measurement (synchroton X-ray diffraction) on only one chloritoid-bearing sample.
The flattening type of fabric is prevalent in previous studies of layered silicates (e.g., Lloyd et al., 2009; Wenk et al., 2010; Dempsey et al., 2011). The basal glide is a dominant deformation mechanism for most phyllosilicates, allowing the basal (001) planes to occur parallel to the rock foliation or the cleavage planes (Wenk et al., 2010). Although chloritoid is classified as orthosilicate, it commonly exhibits the physical and structural properties of phyllosilicates due to the layered structure, which consists of octahedral sheets bonded by layers of isolated silicate tetrahedra (Klein, 2002; Nesse, 2009). The basal glide could, therefore, be a plausible deformation mechanism of the chloritoid. An alternative explanation is the formation of the chloritoid LPO by dislocation creep, manifested by undulose extinction of the chloritoid in sample #10–16 (Supplementary Figure 2).
Chloritoid Stability and Its Implication for the Seismic Anisotropy in Subduction Zones
A strong trench-parallel seismic anisotropy of S-waves has been observed in many subduction zones such as Ryukyu, Izu-Bonin, Mariana, and Tonga (Long, 2013 and references there in). An anisotropic forearc mantle has been proposed as the major source in terms of the B-type LPO of olivine in the hydrated mantle (Jung and Karato, 2001; Kneller et al., 2005; Jung et al., 2006; Karato et al., 2008; Nagaya et al., 2014), the trench-parallel flow in the sub-slab mantle (Russo and Silver, 1994), the pressure-induced olivine LPO (Jung et al., 2009; Ohuchi et al., 2011; Lee and Jung, 2015), and the strong LPO of hydro-phyllosilicates (Katayama et al., 2009; Jung, 2011, 2017; Nagaya et al., 2016; Ha et al., 2018; Lee et al., 2020). However, the strong seismic anisotropy in some subduction zones cannot be solely due to the LPO of olivine (Wirth and Long, 2012). Recent geodynamic studies using realistic slab parameters showed that pure trench-parallel flow is unlikely to be dominant in the sub-slab mantle (e.g., Alisic et al., 2012). The LPO of anisotropic hydrous minerals in subduction zones may, therefore, be an important manifestation in the trench-parallel seismic anisotropy.
Thermodynamic phase stability indicates that chloritoid is likely to be stable between a depth range of 80 and 120 km in subducting hydrated MORB (Schmidt and Poli, 1998; Figure 7A). The slab geotherms in steeply dipping subduction zones such as the Mariana (slab-dip angle = 57–62°), the Izu-Bonin (slab-dip angle = 46–63°), the Tonga-Kermadec (slab-dip angle = 52–56°), and the Nicaragua (slab-dip angle = 62°) (Syracuse et al., 2010) settings, which display a strong trench-parallel seismic anisotropy, suggest that chloritoid is likely to be stable along the interface of the overlying mantle wedge and the hydrated oceanic slab at a depth range between 80 and 120 km (Figure 7B) (Schmidt and Poli, 1998; Syracuse et al., 2010). Recent studies suggest that the subducting oceanic crust and the slab-mantle interface are pervasively hydrated (Abers et al., 2017) and thus might be an important source of the trench-parallel anisotropy (Huang et al., 2011).
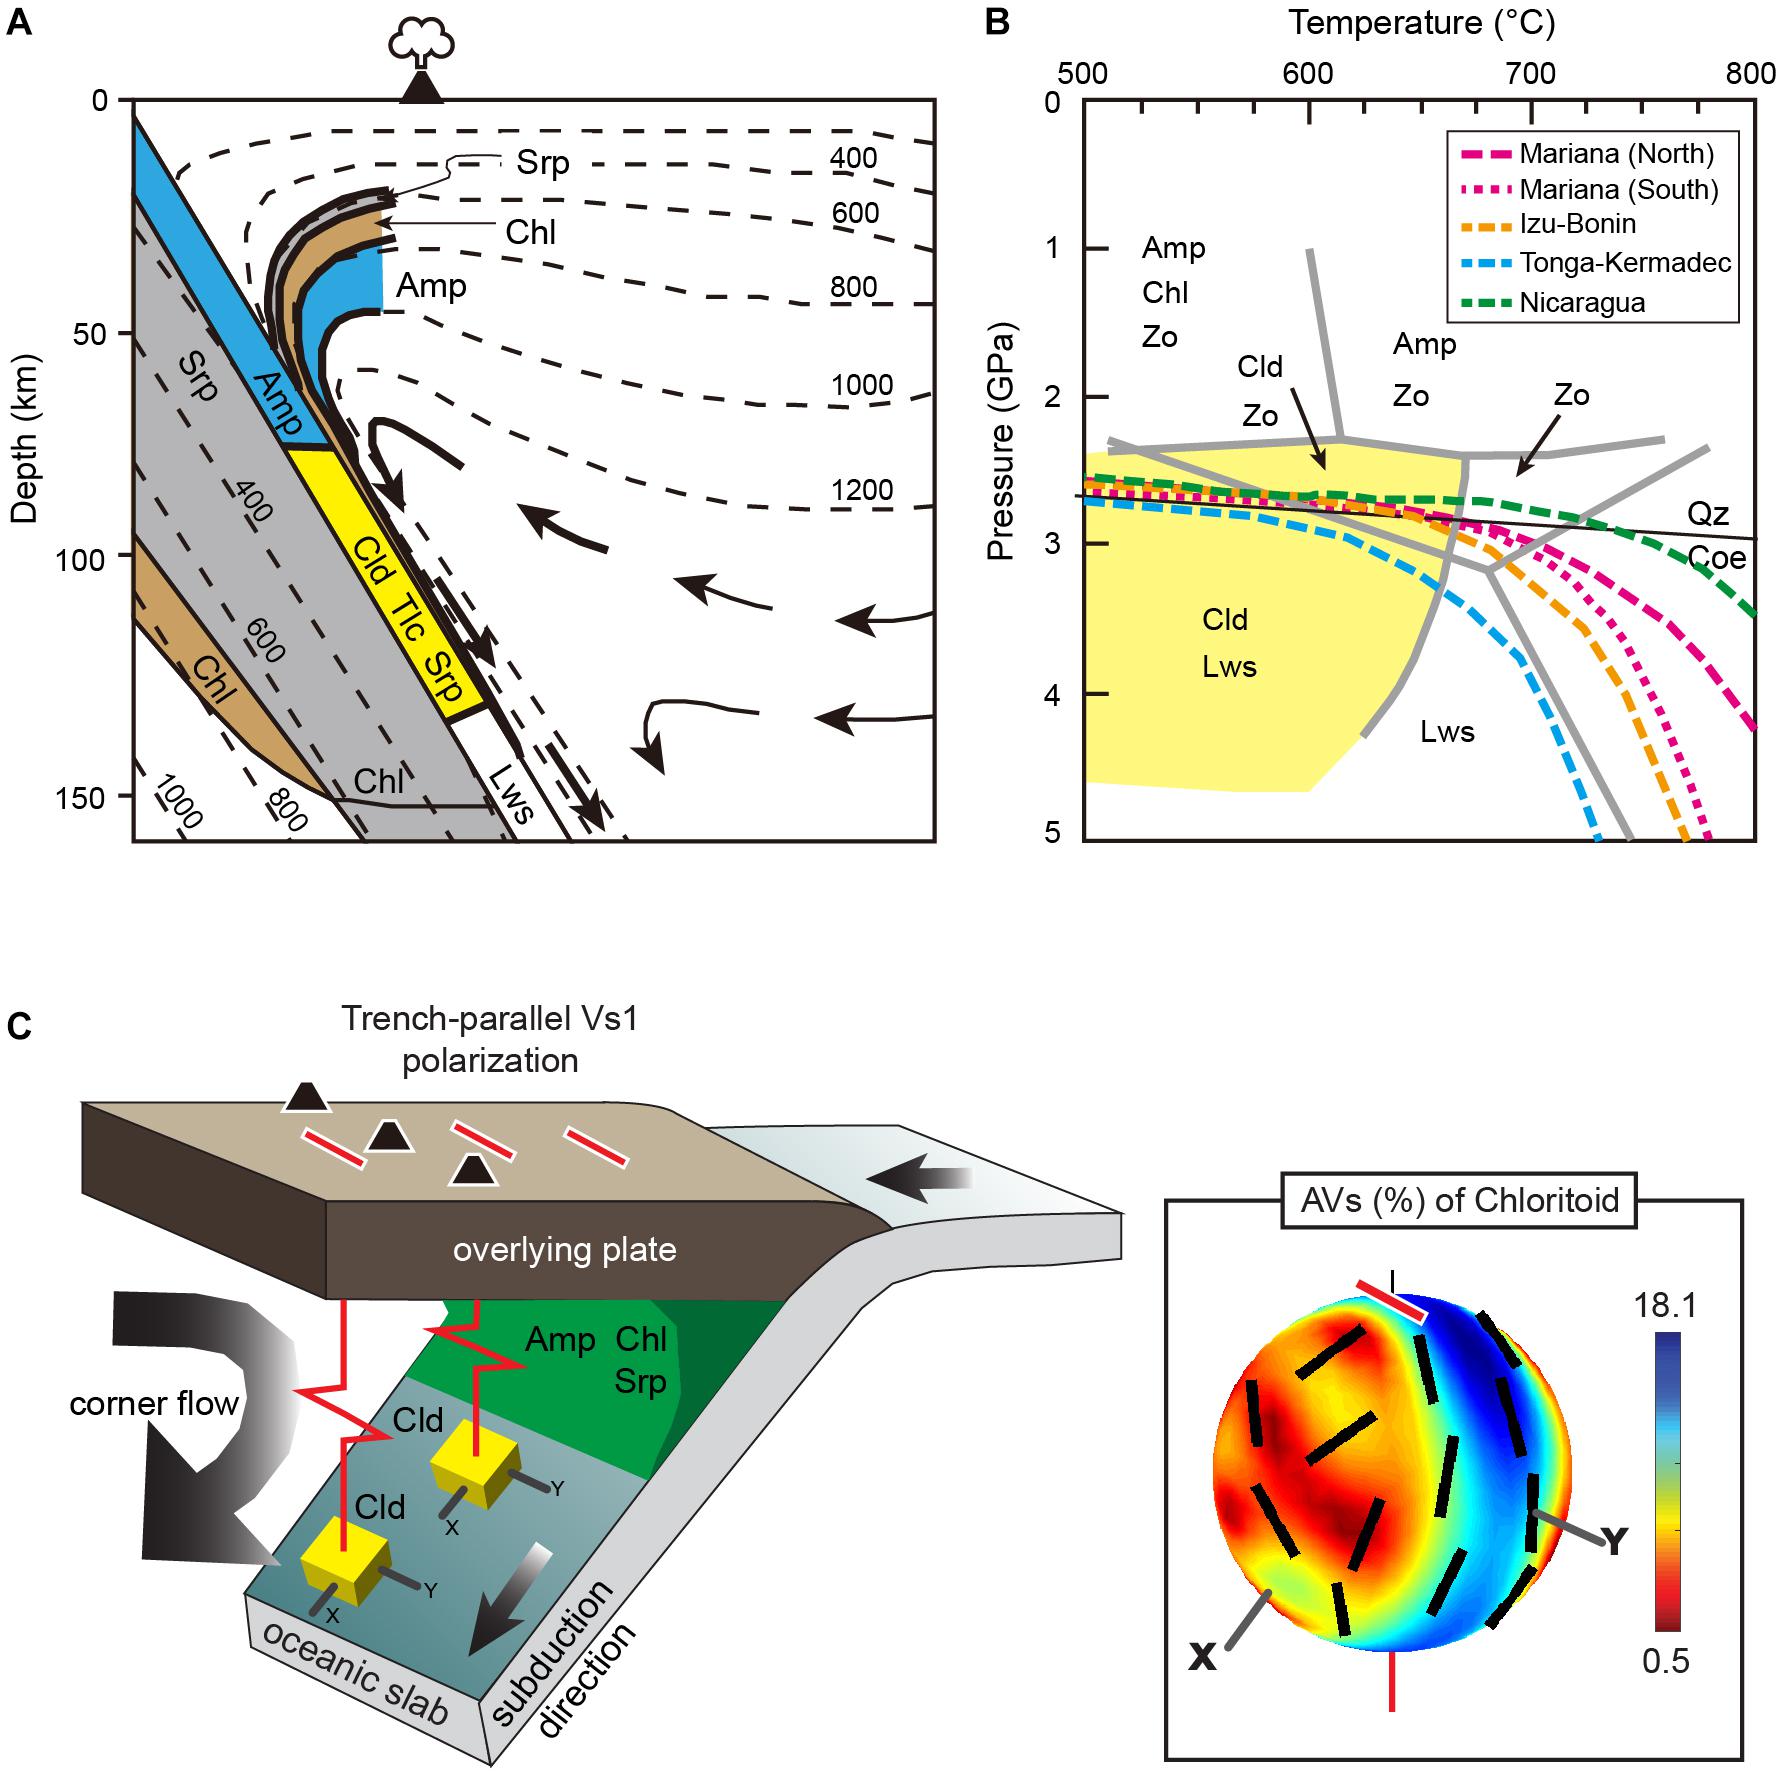
Figure 7. (A) Schematic diagram illustrating a subducting slab with a dipping angle of 60°. Also shown are the thermodynamic stability fields of hydrous phases in the hydrated peridotitic layer, overlying the oceanic crystal layer and the mantle wedge region (modified after Schmidt and Poli, 1998). Stippled lines are isotherms and arrows indicate flow lines in the mantle wedge. (B) Pressure-temperature stability fields of hydrous phases in hydrated MORB under subduction zone conditions (modified after Schmidt and Poli, 1998). Dashed lines are the P–T paths of the slab surface for the Mariana, Izu-Bonin, Tonga-Kermadec, and Nicaragua settings (Syracuse et al., 2010). Yellow shaded region indicates the stability field of chloritoid based on the pseudosection modeling conducted here (Figure 6 and Supplementary Figures 3, 4) and also on previous estimates (Schmidt and Poli, 1998). (C) Schematic diagram of a subduction zone illustrates the influence of the chloritoid LPO on the seismic anisotropy in the subduction zone. The applied slab-dip is 60° (rotation around the axis parallel to the Y-direction; see section “Discussion”) and the lineation (X-direction) is assumed to be parallel to the subduction direction. Red bars represent the polarization direction of the fast S-wave. Inset figure shows shear wave anisotropy (AVS) and the polarization directions of fast S-waves (red and black bars) going through the chloritoid aggregates (sample #15R). X and Z represent the lineation (flow direction) and the direction perpendicular to the foliation (flow plane), respectively.
To evaluate the effect of chloritoid on the seismic anisotropy observed in subduction zones, the three-dimensional seismic anisotropy pattern of chloritoid aggregates was calculated using the chloritoid LPO of sample #15R (Figure 7C), which showed the strongest AVS (up to ∼18%) among the samples analyzed here. In the present study, the subduction zone setting was simplified by using a 2-D corner (slab-parallel) flow model that resulted from viscous coupling between the downgoing slab and the overlying mantle (van Keken et al., 2002). Thus, the respective slab-dip angle was applied to the chloritoid LPO and the seismic anisotropy pattern by rotation around the axis parallel to the Y-direction, which is normal to the lineation parallel to the downgoing flow direction (Figure 7C). The higher the slab-dip angle, the higher is the strength of the AVS using the chloritoid aggregate, which most likely also causes a longer delay time >0.2 s at a dip-angle θ >45°. Subduction zones that show strong trench-parallel S-wave anisotropies (with a long delay time of up to 1–2 s) are also characterized by large dipping slab angles of 40–60° as displayed by the Ryukyu, Mariana, Izu-Bonin, and Tonga subduction zone settings (Long and Silver, 2008). For example, the Tonga and Mariana slabs have steep subducting angles (50–70°) and show a strong trench-parallel seismic anisotropy under the forearc and arc regions (Smith et al., 2001; Pozgay et al., 2007). Since the AVS pattern of the polycrystalline chloritoid was controlled by the chloritoid LPO and implied an importance of high-angle slab dip geometry (Figure 7C), the effect of the chloritoid LPO on the seismic anisotropy is thought to be important in cold and high-angle subduction zones.
Effect of Chloritoid LPO on Seismic Anisotropy of the Grt-Cld-Tlc Schist
Garnet is one of the major minerals in the Grt-Cld-Tlc schists, and is seismically nearly isotropic (AVP = 0.5%, max AVS = 1.2% of single garnet crystal) (Babuška et al., 1978). Chloritoid and talc, which are the other major constituent minerals in the Grt-Cld-Tlc schist, are hydrous layered silicates and are elastically anisotropic. Talc in particular has been shown to be an important mineral that influences the strong trench-parallel seismic anisotropy of hydrated slab–mantle interfaces (Lee et al., 2020; Nagaya et al., 2020). The bulk seismic anisotropies of the three Grt-Cld-Tlc schist samples studied here (#15R, #10–16, and #12–52) were determined in an earlier study (Lee et al., 2020), which, however, did not consider the chloritoid LPO due to the lack of elasticity data of single chloritoid crystal at that time. Using the new elasticity data of single-crystal chloritoid and the LPO of chloritoid aggregates, we calculated the complete bulk seismic anisotropy of the Grt-Cld-Tlc schist samples in this study (Supplementary Figure 5). The integration of the chloritoid LPO and its volume fraction revealed that the chloritoid LPOs caused a weakening of the bulk P-wave seismic anisotropies of the Grt-Cld-Tlc schist (AVP = 14.6–28.1%) when compared to those determined in the former “chloritoid-absent” whole rock (AVP = 19.1–31.2%) study of Lee et al. (2020). This is thought to be associated with the significantly lower P-wave seismic anisotropies of the chloritoid aggregates (AVP = 5.3–10.3%), seeing the much higher P-wave seismic anisotropies (AVP = 67.3–72.3%) of the abundant talc aggregates (Lee et al., 2020). On the other hand, the chloritoid LPO slightly increased the maximum AVS of the entire rock samples #15R and #12–52, and decreased that of sample #10–16 (Lee et al., 2020). This observation indicates that the whole rock mineral assemblage is important to determine the role of chloritoid in the whole rock S-wave anisotropy.
We used sample #15R, which displayed the strongest chloritoid LPO (Figure 3), to calculate the effect of the slab-dip angle and the sample geometries on the ray path of a vertically incident S-wave through chloritoid and the entire rock specimen (Figure 8). The sample geometry is defined with respect to the sample foliation (X–Y plane normal to Z) and sample lineation (X). The values approaching 0° correspond to the trench-parallel VS1 polarization direction, and those approaching 90° to the trench-normal VS1 polarization direction (see right column of Figure 8). These calculations revealed that under broad sample geometry conditions, the talc LPO produced a longer delay time than the chloritoid LPO. The maximum delay time generated by chloritoid is ∼70% of that generated by talc. In the Grt-Cld-Tlc schist, a trench-parallel VS1 polarization direction is achieved when the shear plane dips at an angle >30° from the horizontal plane (i.e., rotation around the Y direction is greater than 30°). When rotating the shear plane around the shear direction at an angle lower than 30°, the VS1 polarization direction is normal to the trench. The maximum delay time (∼0.4 s) of the Grt-Cld-Tlc schist is generated when the shear plane is dipping < 50° and its rotation around the shear direction is >60° (Figure 8), resulting in a trench-normal VS1 polarization direction of the Grt-Cld-Tlc schist. However, When the shear plane dipped at an angle >30° (i.e., rotation around the Y-direction >30°), the variation of the whole rock VS1 polarization direction is similar to that of the talc aggregate when using a shear plane dip angle >30° (i.e., rotation around the Y-direction > 30°). Overall, it was observed that the geometries of the S-wave anisotropy of the Grt-Cld-Tlc schist are significantly more influenced by the talc LPO than by the chloritoid LPO.
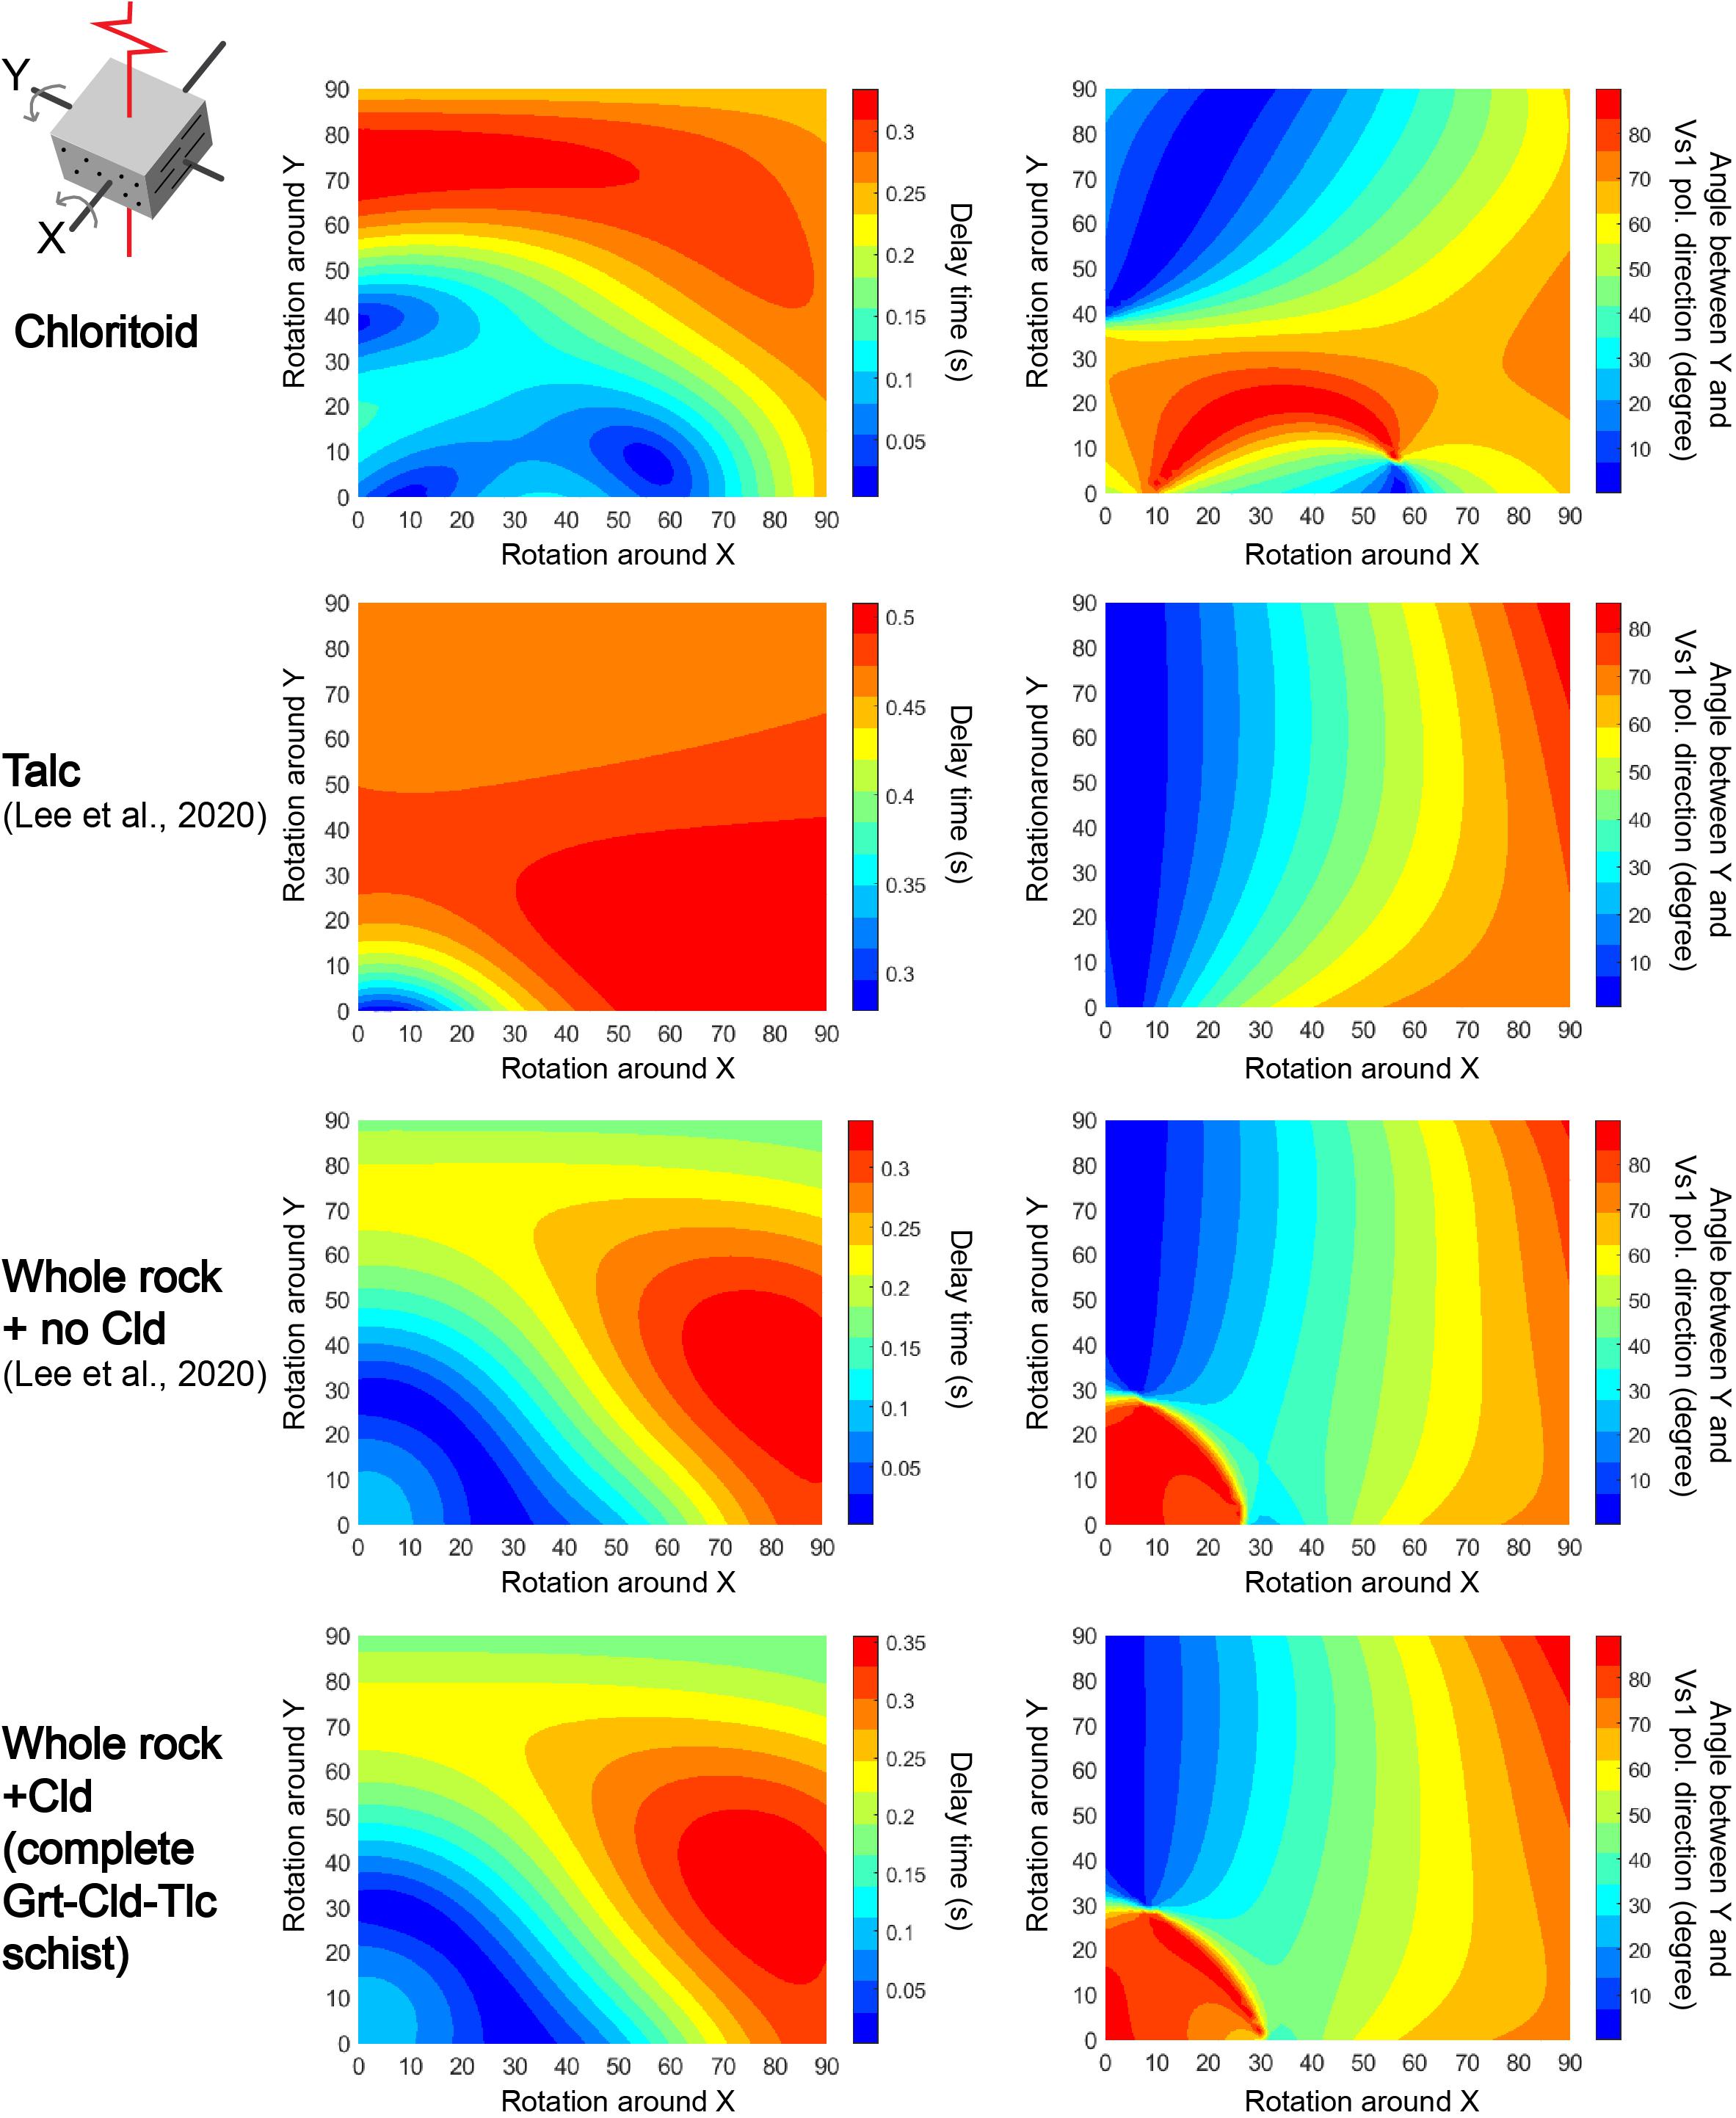
Figure 8. Illustration of the 3–D effect of chloritoid, talc, and the Grt-Cld-Tlc schist on a vertically incident S-wave. LPO data of garnet and talc (Lee et al., 2020) and chloritoid (this study) of sample #15R were used for the calculation. An anisotropic layer with a thickness of 10 km was assumed. The rotation around X and Y from 0° to 90° was illustrated to display the effect of the dipping foliation (X-Y plane) where X is parallel to the shear direction and Y is parallel to the strike of the hypothetical trench. The left column shows contour plots displaying the effect of sample orientation on the delay time (dt), with blue (short delay times) to red (long delay times) colors. The right column shows contour plots displaying the variation of the angle between the fast S-wave polarization direction (VS1 pol. direction) and the hypothetical strike of the trench (Y) as the sample is rotated around X and Y. Colors range from blue (trench–parallel fast directions) to red (trench–normal fast directions). In the uppermost left, the schematic sample geometry is illustrated to show how the sample (X–Y plane = foliation, dots, and lines = lineation) is rotated with respect to the incoming S-waves (red line).
Effect of Hydrous Minerals in Blueschist-Facies Rock on Seismic Anisotropy
Considering previous geothermobarometrical studies (see Meyer et al., 2014, and referenced therein) and the pseudosections calculated here, chloritoid is found to be stable under high-pressure conditions ranging from the blueschist to the eclogite facies. The here calculated pseudosections for metapelites and metagabbros revealed that a number of hydrous minerals such as glaucophane (Gln), lawsonite (Lws), chlorite (Chl), and phengitic white mica (Ms) are stable with chloritoid under high-pressure conditions (Supplementary Figures 3A, 4A). In order to compare the contributions of these minerals to the seismic anisotropy of a subducted slab, we calculated the delay time and the polarization directions of the fast S-waves, with a vertically incident S-wave ray path traveling though the hydrous minerals, and various sample geometries and slab-dip angles (Figure 9). In addition, we compared these data with the whole-rock seismic anisotropy of a hypothetical blueschist, comprising the respective hydrous mineral assemblages (Figure 9) with a modal composition of Gln:Lws:Chl:Phg:Cld = 30:25:15:15:15 (vol.%). For sample geometry consistency, the foliations of the different rock samples were assumed to be parallel, and, furthermore, we followed the previously published original 2-D plots of the seismic anisotropy of both glaucophane and lawsonite (cf. Cao et al., 2013; Choi et al., in unpublished). The magnitude of the seismic anisotropies and the S-wave velocities are summarized in Table 3.
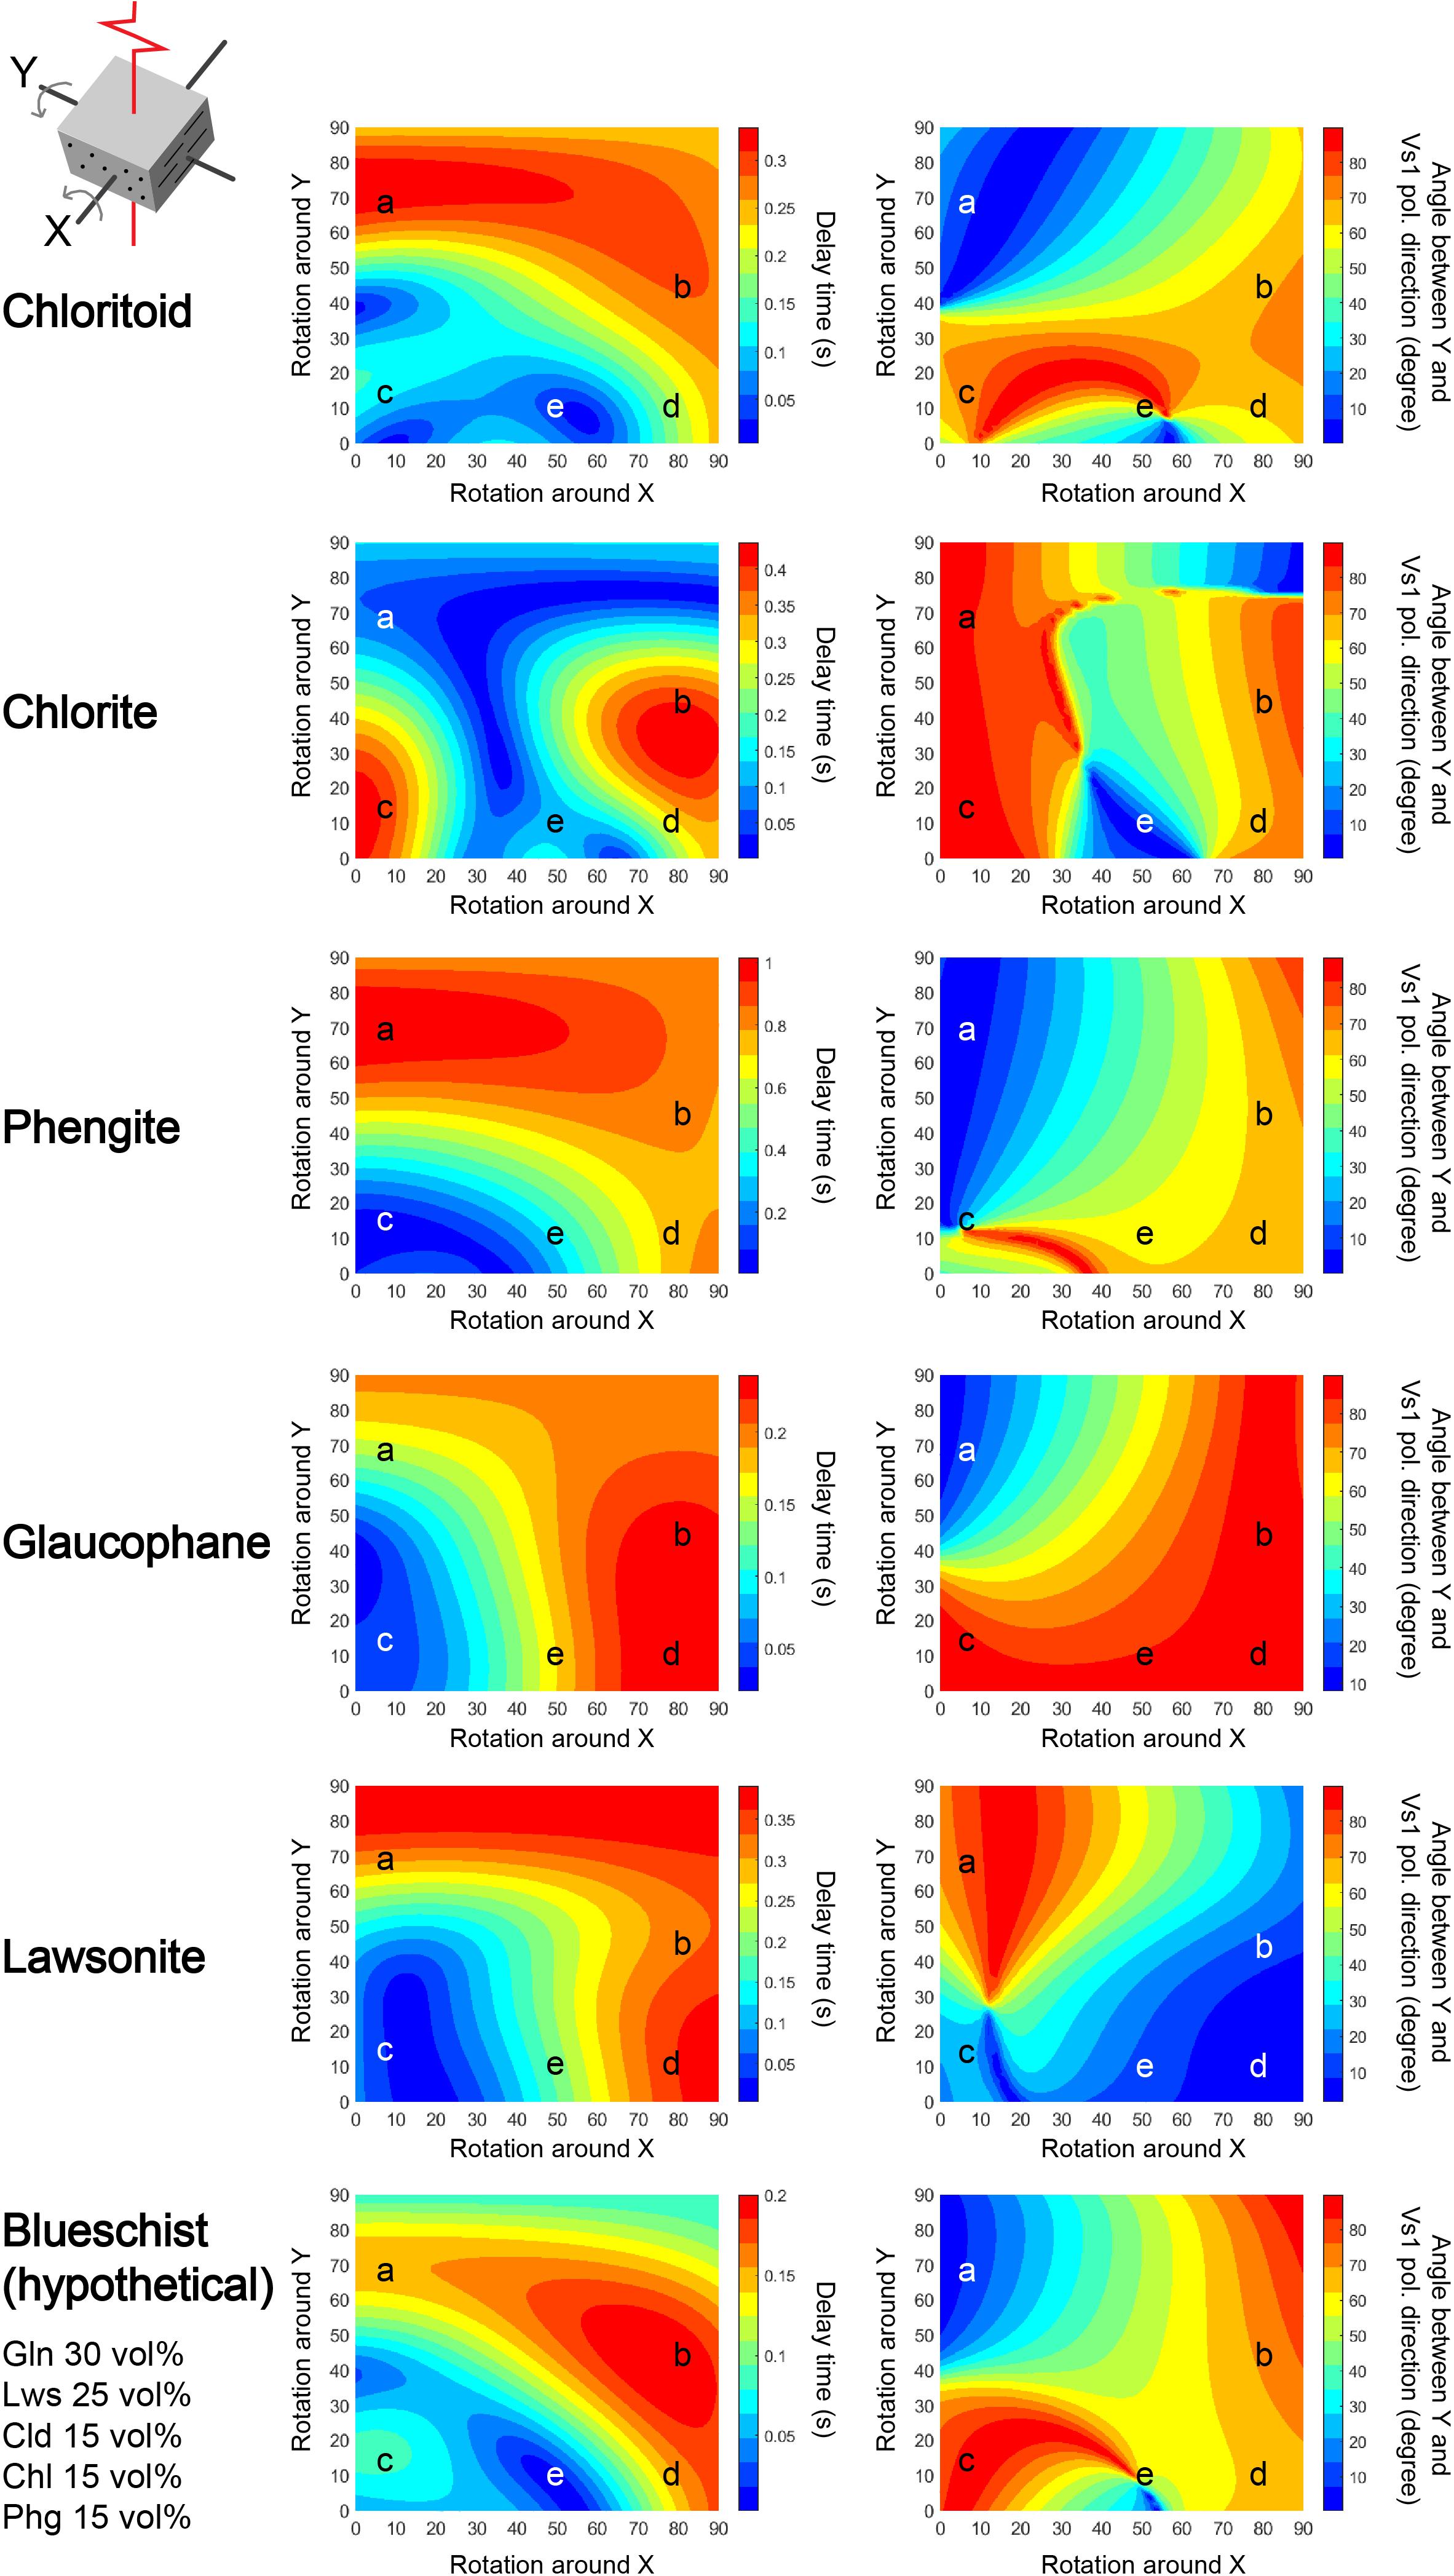
Figure 9. Representation of the effect of the glaucophane, lawsonite, chlorite, phengite, and chloritoid on the delay time and fast S-wave polarization direction of a vertically incident S wave, and that of the bulk seismic anisotropy of a hypothetical blueschist, consisting of glaucophane (Gln):lawsonite (Lws):chlorite (Chl):phengite (Phg):chloritoid (Cld) = 30:25:15:15:15 (vol.%). The LPO data of each polycrystalline mineral were obtained from previous studies on naturally deformed blueschists [glaucophane aggregate from Cao et al. (2013) and lawsonite aggregate from Choi et al. (in unpublished)] and this study (LPOs of chlorite, phengite, and chloritoid in sample #15R). An anisotropic layer thickness of 10 km was assumed for consistency. The reference frame for the rotation and the sample orientation (schematics in the upper left) is the same as in Figure 8. Color ranges describe the same parameters as in Figure 8 for both delay time and fast polarization direction. Symbols marked with “a”–“e” indicate five different ray paths and sample geometries.
Our calculations demonstrated that the ray path (a, b, c, d, and e) and the sample geometries, which can generate a long delay time with the trench-parallel S-wave anisotropy, were different for the five hydrous minerals. The chloritoid and phengite LPOs produced their maximum delay time (∼ 0.3 and ∼1.0 s, respectively) with a trench-parallel or -subparallel VS1 polarization direction, a steep dipping shear plane > 60° (i.e., rotation around Y direction was greater than 60°), and a shear plane rotation around the shear direction (i.e., rotation around the X-direction) at an angle lower than 30° (ray path “a” in Figure 9). The chlorite LPO (cf. sample #15R) displayed its maximum delay time (∼0.4 s) with a trench-normal VS1 polarization direction, a shear plane dip angle < 40°, and a rotation angle of < 10° or > 70° around the shear direction (ray path near “c” and “d,” respectively in Figure 9). The glaucophane LPO generated its maximum delay time (∼0.2 s) with a trench-normal VS1 polarization direction, a shear plane dip-angle below ∼40° and a rotation angle > 70° around the shear direction (ray path near “d” in Figure 9). The lawsonite LPO generated its maximum delay time (∼0.4 s) with a steep shear plane dip-angle greater than ∼70° (ray path from “a” to “b” in Figure 9), or with a shear plane rotation around the shear direction at an angle of >70° (ray path from “b” to “d” in Figure 9). The latter case corresponds to a high-angle fault present in subducting slabs. The lawsonite LPO also produced a trench-parallel anisotropy at a shear plane rotation angle >50° around the shear direction. Among the different minerals considered here, the chloritoid and phengite LPOs mainly contribute to the trench-parallel polarization of the VS1 with a long delay time (near the ray path “a” in a wide field of blue color in the right column plots in Figure 9) at a large slab dip angle, corresponding to a cold and old subducted slab.
The hypothetical blueschist displayed the maximum delay time of ∼0.2 s, which is the shorter than that of all the composite minerals studied here (see bottom of Figure 9). This is thought to be due to the following two characteristics: (1) the presence of large amounts of glaucophane, which displays the shortest maximum delay time of the minerals studied here, in the blueschist (Figure 9), and (2) the low absolute values of the S-wave velocities of the polycrystalline phengite, lawsonite, and chlorite (Table 3). The presence of “slow” phengite (i.e., minimum VS1 = 3.2 km/s and minimum VS2 = 2.9 km/s) seems to significantly decrease the maximum S-wave velocity of the blueschist (Table 3), thereby causing a decrease of the maximum S-wave anisotropy and the shorter delay time of the blueschist (Figure 9). Thus, the S-wave velocities of seismically anisotropic minerals such as chlorite and phengite with different velocity ranges may reduce the entire rock’s seismic anisotropy. In the present study, chloritoid is the only hydrous mineral (VS1 = 4.7–5.4 km/s, VS2 = 4.5–5.2 km/s) that displayed higher S-wave velocities than glaucophane (VS1 = 4.4–4.9 km/s, VS2 = 4.3–4.5 km/s) (Table 3).
The delay time pattern of the hypothetical blueschist was mostly similar to that of the chloritoid compared to the other hydrous minerals, i.e., long delay times were generated by the ray paths “a” and “b,” and short delay times by the ray paths “c” and “e,” with the shortest delay time along the ray path “e.” The pattern of the VS1 polarization direction of the blueschist was also similar to that of the chloritoid (Figure 9). In order to generate trench-parallel polarization of the blueschist with a measurable delay time of >0.1 s near the ray path of “a,” a shear plane dip-angle of >∼50° to a horizontal surface (i.e., rotation around the Y direction > 50°) was required. Similar conditions were required to generate trench-parallel anisotropy in the LPOs of chloritoid, phengite, and glaucophane (Figure 9). On the other hand, the trench-normal S-wave anisotropy with a measurable delay time of the blueschist is mostly affected by the LPO of the chlorite, phengite, and glaucophane near the ray path of “b.” Chloritoid and phengite mostly contribute to the S-wave anisotropy of blueschists and can influence the trench-parallel anisotropy with a long delay time in cold subducting slabs.
Conclusion
The elastic anisotropy of chloritoid single-crystals was calculated for the first time and used to examine the seismic anisotropy for chloritoid-bearing rocks in subducting oceanic crust. The elastic stiffness tensor of single-crystal monoclinic chloritoid showed a high elastic anisotropy of chloritoid reflected by AVP = 22% and max AVS = 47%. The LPO of the polycrystalline chloritoid from the UHP schists showed a strong alignment of the [001] axes of chloritoid subnormal to the foliation. The strongest chloritoid LPO showed a concentration or girdle distribution of the [100] axes and the (010) poles subparallel to the foliation. The re-evaluated stability field of the chloritoid revealed the stability of a significant amount of chloritoid in high-pressure and low-temperature subduction zones, particularly in Al-rich metapelites and metagabbros. The LPOs of the polycrystalline chloritoid produced a strong trench-parallel seismic anisotropy. The chloritoid LPOs tend to reduce the bulk seismic anisotropy of the Grt-Cld-Tlc schists due to their lower volume fraction and lower seismic anisotropy compared to other abundant hydrous minerals such as talc. However, depending on the mineral assemblage and slab geometry, chloritoid, in association with glaucophane and phengite, can influence the seismic anisotropy of blueschist-facies rocks in cold subduction zones.
Data Availability Statement
All datasets generated for this study are included in the article/Supplementary Material, further inquiries can be directed to the corresponding author/s.
Author Contributions
JL measured the LPO and calculated the seismic velocity and anisotropy. MM calculated the elastic constants. TK assisted the use of thermodynamic code. HJ guided the project. RK collected the rock samples. JL, MM, and HJ analyzed the data. JL, MM, TK, HJ, and RK wrote the manuscript. All authors contributed to the article and approved the submitted version.
Funding
HJ acknowledges funding support from the National Research Foundation of Korea (NRF: 2020R1A2C2003765). MM acknowledges funding support from the US NSF Grants EAR–1763215; EAR–1753125; and XSEDE resources TG–GEO170003. RK acknowledges funding support from the Deutsche Forschungsgemeinschaft (KL692/17–3).
Conflict of Interest
The authors declare that the research was conducted in the absence of any commercial or financial relationships that could be construed as a potential conflict of interest.
Acknowledgments
D. Konopelko and O. Vokueva assisted in obtaining field data and collecting samples, and DK introduced RK to the study area and shared his detailed geological knowledge on the Kyrgyz Tianshan.
Supplementary Material
The Supplementary Material for this article can be found online at: https://www.frontiersin.org/articles/10.3389/feart.2021.644958/full#supplementary-material
References
Abers, G. A., Van Keken, P. E., and Hacker, B. R. (2017). The cold and relatively dry nature of mantle forearcs in subduction zones. Nat. Geosci. 10, 333–337. doi: 10.1038/ngeo2922
Alisic, L., Gurnis, M., Stadler, G., Burstedde, C., and Ghattas, O. (2012). Multi-scale dynamics and rheology of mantle flow with plates. J. Geophys. Res. Solid Earth 117, 1–13. doi: 10.1029/2012JB009234
Almqvist, B. S. G., and Mainprice, D. (2017). Seismic properties and anisotropy of the continental crust: predictions based on mineral texture and rock microstructure. Rev. Geophys. 55, 367–433. doi: 10.1002/2016RG000552
Babuška, V., Fiala, J., Kumazawa, M., Ohno, I., and Sumino, Y. (1978). Elastic properties of garnet solid-solution series. Phys. Earth Planet. Inter. 16, 157–176. doi: 10.1016/0031-9201(78)90086-9
Baldwin, J. A., Powell, R., Brown, M., Moraes, R., and Fuck, R. A. (2005). Modelling of mineral equilibria in ultrahigh-temperature metamorphic rocks from the Anápolis-Itauçu Complex, central Brazil. J. Metamorph. Geol. 23, 511–531. doi: 10.1111/j.1525-1314.2005.00591.x
Beaumont, C., Jamieson, R. A., Butler, J. P., and Warren, C. J. (2009). Crustal structure: a key constraint on the mechanism of ultra-high-pressure rock exhumation. Earth Planet. Sci. Lett. 287, 116–129. doi: 10.1016/j.epsl.2009.08.001
Ben Ismaïl, W., and Mainprice, D. (1998). An olivine fabric database: an overview of upper mantle fabrics and seismic anisotropy. Tectonophysics 296, 145–157. doi: 10.1016/S0040-1951(98)00141-3
Boneh, Y., Wallis, D., Hansen, L. N., Krawczynski, M. J., and Skemer, P. (2017). Oriented grain growth and modification of ‘frozen anisotropy’ in the lithospheric mantle. Earth Planet. Sci. Lett. 474, 368–374. doi: 10.1016/j.epsl.2017.06.050
Bunge, H. J. (1982). Texture Analysis in Materials Science: Mathematical Methods. London: Butterworth&Co.
Cao, Y., Jung, H., and Song, S. (2013). Petro-fabrics and seismic properties of blueschist and eclogite in the North Qilian suture zone, NW China: implications for the low-velocity upper layer in subducting slab, trench-parallel seismic anisotropy, and eclogite detectability in the subduction zone. J. Geophys. Res. Solid Earth 118, 3037–3058. doi: 10.1002/jgrb.50212
Cao, Y., Jung, H., and Song, S. (2017). Olivine fabrics and tectonic evolution of fore-arc mantles: a natural perspective from the Songshugou dunite and harzburgite in the Qinling orogenic belt, central China. Geochem. Geophys. Geosyst. 18, 907–934. doi: 10.1002/2016GC006614
Chen, Y., Ye, K., Wu, T. F., and Guo, S. (2013). Exhumation of oceanic eclogites: thermodynamic constraints on pressure, temperature, bulk composition and density. J. Metamorph. Geol. 31, 549–570. doi: 10.1111/jmg.12033
Chheda, T. D., Mookherjee, M., Mainprice, D., dos Santos, A. M., Molaison, J. J., Chantel, J., et al. (2014). Structure and elasticity of phlogopite under compression: geophysical implications. Phys. Earth Planet. Inter. 233, 1–12. doi: 10.1016/j.pepi.2014.05.004
Coggon, R., and Holland, T. J. B. (2002). Mixing properties of phengitic micas and revised garnet-phengite thermobarometers. J. Metamorph. Geol. 20, 683–696. doi: 10.1046/j.1525-1314.2002.00395.x
Comodi, P., Mellini, M., and Zanazzi, P. F. (1992). Magnesiochloritoid: Compressibility and high pressure structure refinement. Phys. Chem. Miner. 18, 483–490. doi: 10.1007/BF00205262
de Capitani, C., and Petrakakis, K. (2010). The computation of equilibrium assemblage diagrams with Theriak/Domino software. Am. Mineral. 95, 1006–1016. doi: 10.2138/am.2010.3354
Dempsey, E. D., Prior, D. J., Mariani, E., Toy, V. G., and Tatham, D. J. (2011). Mica-controlled anisotropy within mid-to-upper crustal mylonites: an EBSD study of mica fabrics in the Alpine Fault Zone, New Zealand. Geol. Soc. Lond. Spec. Publ. 360, 33–47. doi: 10.1144/SP360.3
Diener, J. F. A., and Powell, R. (2012). Revised activity-composition models for clinopyroxene and amphibole. J. Metamorph. Geol. 30, 131–142. doi: 10.1111/j.1525-1314.2011.00959.x
Faccenda, M., Burlini, L., Gerya, T. V., and Mainprice, D. (2008). Fault-induced seismic anisotropy by hydration in subducting oceanic plates. Nature 455, 1097–1100. doi: 10.1038/nature07376
Green, E., Holland, T. J. B., and Powell, R. (2007). An order-disorder model for omphacitic pyroxenes in the system jadeite-diopside-hedenbergite-acmite, with applications to eclogitic rocks. Am. Mineral. 92, 1181–1189. doi: 10.2138/am.2007.2401
Grevel, K.-D., Kahl, W.-A., Majzlan, J., Navrotsky, A., Lathe, C., and Fockenberg, T. (2005). Thermodynamic properties of magnesiochloritoid. Eur. J. Mineral. 17, 587–598. doi: 10.1127/0935-1221/2005/0017-0587
Ha, Y., Jung, H., and Raymond, L. A. (2018). Deformation fabrics of glaucophane schists and implications for seismic anisotropy: the importance of lattice preferred orientation of phengite. Int. Geol. Rev. 61, 1–18. doi: 10.1080/00206814.2018.1449142
Haerinck, T., Adriaens, R., Debacker, T. N., Hirt, A. M., and Sintubin, M. (2013). Paramagnetic metamorphic mineral assemblages controlling AMS in low-grade deformed metasediments and the implications with respect to the use of AMS as a strain marker. J. Geol. Soc. Lond. 170, 263–280. doi: 10.1144/jgs2012-062
Haerinck, T., Wenk, H.-R., Debacker, T. N., and Sintubin, M. (2015). Preferred mineral orientation of a chloritoid-bearing slate in relation to its magnetic fabric. J. Struct. Geol. 71, 125–135. doi: 10.1016/j.jsg.2014.09.013
Hansen, L. N., Zhao, Y. H., Zimmerman, M. E., and Kohlstedt, D. L. (2014). Protracted fabric evolution in olivine: Implications for the relationship among strain, crystallographic fabric, and seismic anisotropy. Earth Planet. Sci. Lett. 387, 157–168. doi: 10.1016/j.epsl.2013.11.009
Hohenberg, P., and Kohn, W. (1964). Inhomogeneous electron gas. Phys. Rev. 136, B864–B871. doi: 10.1103/PhysRev.136.B864
Holland, T. J. B., Baker, J., and Powell, R. (1998). Mixing properties and activity-composition relationships of chlorites in the system MgO-FeO-Al2O3-SiO2-H2O. Eur. J. Mineral. 10, 395–406. doi: 10.1127/ejm/10/3/0395
Holland, T. J. B., and Powell, R. (1998). An internally consistent thermodynamic data set for phases of petrological interest. J. Metamorph. Geol. 16, 309–343. doi: 10.1111/j.1525-1314.1998.00140.x
Holland, T. J. B., and Powell, R. (2011). An improved and extended internally consistent thermodynamic dataset for phases of petrological interest, involving a new equation of state for solids. Journal of Metamorphic Geology 29, 333–383. doi: 10.1111/j.1525-1314.2010.00923.x
Horn, C., Bouilhol, P., and Skemer, P. (2020). Serpentinization, deformation, and seismic anisotropy in the subduction mantle wedge. Geochem. Geophys. Geosyst. 21, 1–17. doi: 10.1029/2020GC008950
Huang, Z., Zhao, D., and Wang, L. (2011). Shear wave anisotropy in the crust, mantle wedge, and subducting Pacific slab under northeast Japan. Geochem. Geophys. Geosyst. 12:Q01002. doi: 10.1029/2010GC003343
Jung, H. (2011). Seismic anisotropy produced by serpentine in mantle wedge. Earth Planet. Sci. Lett. 307, 535–543. doi: 10.1016/J.EPSL.2011.05.041
Jung, H. (2017). Crystal preferred orientations of olivine, orthopyroxene, serpentine, chlorite, and amphibole, and implications for seismic anisotropy in subduction zones: a review. Geosci. J. 21, 985–1011. doi: 10.1007/s12303-017-0045-1
Jung, H., and Karato, S. (2001). Water-induced fabric transitions in olivine. Science 293, 1460–1463. doi: 10.1126/science.1062235
Jung, H., Katayama, I., Jiang, Z., Hiraga, T., and Karato, S. (2006). Effect of water and stress on the lattice-preferred orientation of olivine. Tectonophysics 421, 1–22. doi: 10.1016/j.tecto.2006.02.011
Jung, H., Mo, W., and Green, H. W. (2009). Upper mantle seismic anisotropy resulting from pressure-induced slip transition in olivine. Nat. Geosci. 2, 73–77. doi: 10.1038/ngeo389
Kang, H., and Jung, H. (2019). Lattice-preferred orientation of amphibole, chlorite, and olivine found in hydrated mantle peridotites from Bjørkedalen, southwestern Norway, and implications for seismic anisotropy. Tectonophysics 750, 137–152. doi: 10.1016/J.TECTO.2018.11.011
Karato, S., Jung, H., Katayama, I., and Skemer, P. (2008). Geodynamic significance of seismic anisotropy of the upper mantle: New insights from laboratory studies. Annu. Rev. Earth Planet. Sci. 36, 59–95. doi: 10.1146/annurev.earth.36.031207.124120
Katayama, I., Hirauchi, K., Michibayashi, K., and Ando, J. (2009). Trench-parallel anisotropy produced by serpentine deformation in the hydrated mantle wedge. Nature 461, 1114–1117. doi: 10.1038/nature08513
Kienast, J. R., and Messiga, B. (1987). Cr-rich Mg-chloritoid, a first record in high-pressure metagabbros from Monviso (Cottian Alps), Italy. Mineral. Mag. 51, 681–687. doi: 10.1180/minmag.1987.051.363.08
Kim, D., and Jung, H. (2015). Deformation microstructures of olivine and chlorite in chlorite peridotites from Almklovdalen in the Western Gneiss Region, southwest Norway, and implications for seismic anisotropy. Int. Geol. Rev. 57, 650–668. doi: 10.1080/00206814.2014.936054
Klemd, R., Gao, J., Li, J.-L., and Meyer, M. (2015). Metamorphic evolution of (ultra)-high-pressure subduction-related transient crust in the South Tianshan Orogen (Central Asian Orogenic Belt): Geodynamic implications. Gondwana Res. 28, 1–25. doi: 10.1016/j.gr.2014.11.008
Kneller, E. A., van Keken, P. E., Karato, S., and Park, J. (2005). B-type olivine fabric in the mantle wedge: Insights from high-resolution non-Newtonian subduction zone models. Earth Planet. Sci. Lett. 237, 781–797. doi: 10.1016/j.epsl.2005.06.049
Kohn, W., and Sham, L. J. (1965). Self-consistent equations including exchange and correlation effects. Phys. Rev. 140, A1133–A1138. doi: 10.1103/PhysRev.140.A1133
Kresse, G., and Joubert, D. (1999). From ultrasoft pseudopotentials to the projector augmented-wave method. Phys. Rev. B 59, 1758–1775. doi: 10.1103/PhysRevB.59.1758
Lee, J., and Jung, H. (2015). Lattice-preferred orientation of olivine found in diamond-bearing garnet peridotites in Finsch, South Africa and implications for seismic anisotropy. J. Struct. Geol. 70, 12–22. doi: 10.1016/j.jsg.2014.10.015
Lee, J., Jung, H., Klemd, R., Tarling, M. S., and Konopelko, D. (2020). Lattice preferred orientation of talc and implications for seismic anisotropy in subduction zones. Earth Planet. Sci. Lett. 537:116178. doi: 10.1016/j.epsl.2020.116178
Lloyd, G. E., Butler, R. W. H., Casey, M., and Mainprice, D. (2009). Mica, deformation fabrics and the seismic properties of the continental crust. Earth Planet. Sci. Lett. 288, 320–328. doi: 10.1016/J.EPSL.2009.09.035
Long, M. D. (2013). Constraints on subduction geodynamics from seismic anisotropy. Rev. Geophys. 51, 76–112. doi: 10.1002/rog.20008
Long, M. D., and Silver, P. G. (2008). The subduction zone flow field from seismic anisotropy: a global view. Science. 319, 315–319. doi: 10.1126/science.1150809
Mainprice, D. (1990). A FORTRAN program to calculate seismic anisotropy from the lattice preferred orientation of minerals. Comput. Geosci. 16, 385–393. doi: 10.1016/0098-3004(90)90072-2
Mainprice, D., Hielscher, R., and Schaeben, H. (2011). Calculating anisotropic physical properties from texture data using the MTEX open-source package. Geol. Soc. Spec. Publ. 360, 175–192. doi: 10.1144/SP360.10
Mainprice, D., and Ildefonse, B. (2009). “Seismic anisotropy of subduction zone minerals-Contribution of hydrous phases,” in Subduction Zone Geodynamics, eds S. Lallemand and F. Funiciello (Berlin: Springer), 63–84. doi: 10.1007/978-3-540-87974-9
Mainprice, D., Le Page, Y., Rodgers, J., and Jouanna, P. (2008). Ab initio elastic properties of talc from 0 to 12 GPa: interpretation of seismic velocities at mantle pressures and prediction of auxetic behaviour at low pressure. Earth Planet. Sci. Lett. 274, 327–338. doi: 10.1016/j.epsl.2008.07.047
Messiga, B., Kienast, J. R., Rebay, G., Riccardi, M. P., and Tribuzio, R. (1999). Cr-rich magnesiochloritoid eclogites from the Monviso ophiolites (Western Alps, Italy). J. Metamorph. Geol. 17, 287–299. doi: 10.1046/j.1525-1314.1999.00198.x
Messiga, B., Scambelluri, M., and Piccardo, G. B. (1995). Chloritoid-bearing assemblages in mafic systems and eclogite-facies hydration of Alpine Mg-Al metagabbros (Erro-Tobbio unit, Ligurian western Alps). Eur. J. Mineral. 7, 1149–1167. doi: 10.1127/ejm/7/5/1149
Meyer, M., Klemd, R., Hegner, E., and Konopelko, D. (2014). Subduction and exhumation mechanisms of ultra-high and high-pressure oceanic and continental crust at Makbal (Tianshan, Kazakhstan and Kyrgyzstan). J. Metamorph. Geol. 32, 861–884. doi: 10.1111/jmg.12097
Michibayashi, K., Mainprice, D., Fujii, A., Uehara, S., Shinkai, Y., Kondo, Y., et al. (2016). Natural olivine crystal-fabrics in the western Pacific convergence region: a new method to identify fabric type. Earth Planet. Sci. Lett. 443, 70–80. doi: 10.1016/j.epsl.2016.03.019
Monkhorst, H. J., and Pack, J. D. (1976). Special points for Brillouin-zone integrations. Phys. Rev. B 13, 5188–5192. doi: 10.1103/PhysRevB.13.5188
Mookherjee, M., and Bezacier, L. (2012). The low velocity layer in subduction zone: structure and elasticity of glaucophane at high pressures. Phys. Earth Planet. Inter. 208–209, 50–58. doi: 10.1016/j.pepi.2012.07.007
Mookherjee, M., and Capitani, G. C. (2011). Trench parallel anisotropy and large delay times: Elasticity and anisotropy of antigorite at high pressures. Geophys. Res. Lett. 38:L09315. doi: 10.1029/2011GL047160
Mookherjee, M., and Mainprice, D. (2014). Unusually large shear-wave anisotropy for chlorite in subductin zone settings. Geophys. Res. Lett. 10, 1506–1513. doi: 10.1002/2014GL059334
Morales, L. F. G., Mainprice, D., and Boudier, F. (2013). The influence of hydrous phases on the microstructure and seismic properties of a hydrated mantle rock. Tectonophysics 594, 103–117. doi: 10.1016/j.tecto.2013.03.022
Nagaya, T., Okamoto, A., Oyanagi, R., Seto, Y., Miyake, A., Uno, M., et al. (2020). Crystallographic preferred orientation of talc determined by an improved EBSD procedure for sheet silicates: implications for anisotropy at the slab–mantle interface due to Si-metasomatism. Am. Mineral 105, 873–893. doi: 10.2138/am-2020-7006
Nagaya, T., Walker, A. M., Wookey, J., Wallis, S. R., Ishii, K., and Kendall, J.-M. (2016). Seismic evidence for flow in the hydrated mantle wedge of the Ryukyu subduction zone. Sci. Rep. 6:29981. doi: 10.1038/srep29981
Nagaya, T., Wallis, S. R., Kobayashi, H., Michibayashi, K., Mizukami, T., Seto, Y., et al. (2014). Dehydration breakdown of antigorite and the formation of B-type olivine CPO. Earth Planet. Sci. Lett. 387, 67–76. doi: 10.1016/j.epsl.2013.11.025
Negulescu, E., Sabau, G., and Massonne, H.-J. (2009). Chloritoid-bearing mineral assemblages in high-pressure metapelites from the Bughea Complex, Leaota Massif (South Carpathians). J. Petrol. 50, 103–125. doi: 10.1093/petrology/egn075
Nicolas, A., and Christensen, N. I. (1987). “Formation of anisotropy in upper mantle peridotites – a review,” in Composition, Structure and Dynamics of the Lithosphere-Asthenosphere System, eds K. Fuchs and C. Froidevaux (Washington, DC: American Geophysical Union), 111–123. doi: 10.1029/GD016
Ohuchi, T., Kawazoe, T., Nishihara, Y., Nishiyama, N., and Irifune, T. (2011). High pressure and temperature fabric transitions in olivine and variations in upper mantle seismic anisotropy. Earth Planet. Sci. Lett. 304, 55–63. doi: 10.1016/j.epsl.2011.01.015
Peng, Y., and Mookherjee, M. (2020). Thermoelasticity of tremolite amphibole: geophysical implications. Am. Mineral. 105, 904–916. doi: 10.2138/am-2020-7189
Poli, S., and Schmidt, M. W. (1997). The high-pressure stability of hydrous phases in orogenic belts: an experimental approach on eclogite-forming processes. Tectonophysics 273, 169–184. doi: 10.1016/s0040-1951(96)00293-4
Pozgay, S. H., Wiens, D. A., Conder, J. A., Shiobara, H., and Sugioka, H. (2007). Complex mantle flow in the Mariana subduction system: evidence from shear wave splitting. Geophys. J. Int. 170, 371–386. doi: 10.1111/j.1365-246X.2007.03433.x
Précigout, J., Prigent, C., Palasse, L., and Pochon, A. (2017). Water pumping in mantle shear zones. Nat. Commun. 8:15736. doi: 10.1038/ncomms15736
Puelles, P., Gil Ibarguchi, J. I., Beranoaguirre, A., and Ábalos, B. (2012). Mantle wedge deformation recorded by high-temperature peridotite fabric superposition and hydrous retrogression (Limo massif, Cabo Ortegal, NW Spain). Int. J. Earth Sci. 101, 1835–1853. doi: 10.1007/s00531-012-0761-8
Regis, D., Rubatto, D., Darling, J., Cenki-Tok, B., Zucali, M., and Engi, M. (2014). Multiple metamorphic stages within an eclogite-facies terrane (Sesia Zone, Western Alps) revealed by Th-U-Pb petrochronology. J. Petrol. 55, 1429–1456. doi: 10.1093/petrology/egu029
Russo, R. M., and Silver, P. G. (1994). Trench-parallel flow beneath the Nazca plate from seismic anisotropy. Science 263, 1105–1111. doi: 10.1126/science.263.5150.1105
Savage, M. K. (1999). Seismic anisotropy and mantle deformation: what have we learned from shear wave splitting? Rev. Geophys. 37, 65–106. doi: 10.1029/98RG02075
Schmidt, M. W., and Poli, S. (1998). Experimentally based water budgets for dehydrating slabs and consequences for arc magma generation. Earth Planet. Sci. Lett. 163, 361–379. doi: 10.1016/S0012-821X(98)00142-3
Shaw, D. M. (1956). Geochemistry of pelitic rocks. Part III: major elements and general geochemistry. Bull. Geol. Soc. Am. 67, 919–934.
Skemer, P., and Hansen, L. N. (2016). Inferring upper-mantle flow from seismic anisotropy: an experimental perspective. Tectonophysics 668–669, 1–14. doi: 10.1016/J.TECTO.2015.12.003
Skemer, P., Katayama, I., Jiang, Z., and Karato, S. I. (2005). The misorientation index: development of a new method for calculating the strength of lattice-preferred orientation. Tectonophysics 411, 157–167. doi: 10.1016/j.tecto.2005.08.023
Smith, G. P., Wiens, D. A., Fischer, K. M., Dorman, L. M., Webb, S. C., and Hildebrand, J. A. (2001). A complex pattern of mantle flow in the Lau Backarc. Science. 292, 713–716. doi: 10.1126/science.1058763
Smye, A. J., Greenwood, L. V., and Holland, T. J. B. (2010). Garnet-chloritoid-kyanite assemblages: eclogite facies indicators of subduction constraints in orogenic belts. J. Metamorph. Geol. 28, 753–768. doi: 10.1111/j.1525-1314.2010.00889.x
Soustelle, V., and Manthilake, G. (2017). Deformation of olivine-orthopyroxene aggregates at high pressure and temperature: implications for the seismic properties of the asthenosphere. Tectonophysics 694, 385–399. doi: 10.1016/J.TECTO.2016.11.020
Syracuse, E. M., van Keken, P. E., Abers, G. A., Suetsugu, D., Bina, C., Inoue, T., et al. (2010). The global range of subduction zone thermal models. Phys. Earth Planet. Inter. 183, 73–90. doi: 10.1016/j.pepi.2010.02.004
Tommasi, A., and Vauchez, A. (2015). Heterogeneity and anisotropy in the lithospheric mantle. Tectonophysics 661, 11–37. doi: 10.1016/J.TECTO.2015.07.026
van Keken, P. E., Kiefer, B., and Peacock, S. M. (2002). High-resolution models of subduction zones: implications for mineral dehydration reactions and the transport of water into the deep mantle. Geochem. Geophys. Geosyst. 3, 1–20. doi: 10.1029/2001GC000256
Vaughan, M. T., and Guggenheim, S. (1986). Elasticity of muscovite and its relationship to crystal structure. J. Geophys. Res. 91, 4657. doi: 10.1029/jb091ib05p04657
Walker, A. M., and Wookey, J. (2012). MSAT—A new toolkit for the analysis of elastic and seismic anisotropy. Comput. Geosci. 49, 81–90. doi: 10.1016/j.cageo.2012.05.031
Wei, C. J., and Song, S. G. (2008). Chloritoid–glaucophane schist in the north Qilian orogen, NW China: phase equilibria and P–T path from garnet zonation. J. Metamorph. Geol. 26, 301–316. doi: 10.1111/j.1525-1314.2007.00753.x
Wenk, H.-R., Kanitpanyacharoen, W., and Voltolini, M. (2010). Preferred orientation of phyllosilicates: comparison of fault gouge, shale and schist. J. Struct. Geol. 32, 478–489. doi: 10.1016/j.jsg.2010.02.003
White, R. W., Powell, R., and Holland, T. J. B. (2007). Progress relating to calculation of partial melting equilibria for metapelites. J. Metamorph. Geol. 25, 511–527. doi: 10.1111/j.1525-1314.2007.00711.x
White, R. W., Powell, R., Holland, T. J. B., and Worley, B. A. (2000). The effect of TiO2 and Fe2O3 on metapelitic assemblages at greenschist and amphibolite facies conditions: mineral equilibria calculations in the system K2O-FeO-MgOAl2O3- SiO2-H2O-TiO2-Fe2O3 J. Metamorph. Geol. 18, 497–511. doi: 10.1046/j.1525-1314.2000.00269.x
Keywords: chloritoid, lattice preferred orientation, seismic anisotropy, EBSD, subduction zone
Citation: Lee J, Mookherjee M, Kim T, Jung H and Klemd R (2021) Seismic Anisotropy in Subduction Zones: Evaluating the Role of Chloritoid. Front. Earth Sci. 9:644958. doi: 10.3389/feart.2021.644958
Received: 22 December 2020; Accepted: 26 February 2021;
Published: 22 March 2021.
Edited by:
Lara S. Wagner, Carnegie Institution for Science (CIS), United StatesReviewed by:
Philip Skemer, Washington University in St. Louis, United StatesJin Zhang, University of New Mexico, United States
Copyright © 2021 Lee, Mookherjee, Kim, Jung and Klemd. This is an open-access article distributed under the terms of the Creative Commons Attribution License (CC BY). The use, distribution or reproduction in other forums is permitted, provided the original author(s) and the copyright owner(s) are credited and that the original publication in this journal is cited, in accordance with accepted academic practice. No use, distribution or reproduction is permitted which does not comply with these terms.
*Correspondence: Haemyeong Jung, hjung@snu.ac.kr