Strain-Induced Fabric Transition of Chlorite and Implications for Seismic Anisotropy in Subduction Zones


Tectonophysics Laboratory, School of Earth and Environmental Sciences, Seoul National University, Seoul 08826, Korea
*
Author to whom correspondence should be addressed.
Minerals 2020, 10(6), 503; https://doi.org/10.3390/min10060503
Submission received: 4 May 2020
/
Revised: 24 May 2020
/
Accepted: 30 May 2020
/
Published: 31 May 2020
(This article belongs to the Special Issue Microtexture Characterization of Rocks and Minerals)
Abstract
:Seismic anisotropy of S-wave, trench-parallel or trench-normal polarization direction of fast S-wave, has been observed in the fore-arc and back-arc regions of subduction zones. Lattice preferred orientation (LPO) of elastically anisotropic chlorite has been suggested as one of the major causes of seismic anisotropy in subduction zones. However, there are two different LPOs of chlorite reported based on the previous studies of natural chlorite peridotites, which can produce different expression of seismic anisotropy. The mechanism for causing the two different LPOs of chlorite is not known. Therefore, we conducted deformation experiments of chlorite peridotite under high pressure–temperature conditions (P = 0.5–2.5 GPa, T = 540–720 °C). We found that two different chlorite LPOs were developed depending on the magnitude of shear strain. The type-1 chlorite LPO is characterized by the [001] axes aligned subnormal to the shear plane, and the type-2 chlorite LPO is characterized by a girdle distribution of the [001] axes subnormal to the shear direction. The type-1 chlorite LPO developed under low shear strain (γ ≤ 3.1 ± 0.3), producing trench-parallel seismic anisotropy. The type-2 chlorite LPO developed under high shear strain (γ ≥ 5.1 ± 1.5), producing trench-normal seismic anisotropy. The anisotropy of S-wave velocity (AVs) of chlorite was very strong up to AVs = 48.7% so that anomalous seismic anisotropy in subduction zones can be influenced by the chlorite LPOs.
1. Introduction
Trench-parallel seismic anisotropy of S-wave has been observed in the fore-arc mantle wedge and subducting slab of many subduction zones [1,2,3,4,5,6,7]. Previous studies suggest that possible causes for trench-parallel fast polarization of seismic anisotropy of S-wave are the B-type olivine lattice preferred orientation (LPO) in the hydrated mantle wedge [8,9,10,11,12,13,14,15,16,17,18,19,20,21,22], pressure-induced olivine LPO [17,23,24], spatial distribution of faults in the hydrated slab [25], trench-parallel flow in the sub-slab mantle [26] and the mantle wedge [2,6,27,28], and the LPOs of hydro-phyllosilicates such as serpentine [29,30,31,32,33,34,35,36,37], chlorite [10,38], and talc [39]. In contrast, trench-normal seismic anisotropy has been observed in the back-arc area of subduction zones [3,6,27,40,41], which has been interpreted as a change in olivine LPO in the back-arc area [11,12,42].
However, seismic anisotropy observed in some fore-arc subduction zones, such as Ryukyu and Cascadia, cannot be explained solely by the olivine LPOs [43,44,45]. McCormack, Wirth, and Long [44] found a thin layer (~6 km) of strong anisotropy (~10–14%) beneath Ryukyu with a slow axis of symmetry directly above the slab; this cannot be explained solely by the olivine LPO. In addition, Wagner, Fouch, James, and Long [45] found trench-parallel seismic anisotropy beneath Cascadia using Rayleigh waves, and suggested that hydrous minerals in the mantle wedge or in the slab may also be responsible for the observed trench-parallel seismic anisotropy.
Chlorite is one of the elastically highly anisotropic hydrous minerals [46,47] with a wide stability field under high pressure and temperature (P–T) conditions in subduction zones [48,49,50,51,52] (Figure 1). Chlorite is stable as chlorite peridotite in the lower part of the mantle wedge and subducting slab [48,51,52]. The deformation of chlorite and formation of its LPO during subduction processes can cause large seismic anisotropy [38,53]. However, the development of the chlorite LPO under high P–T conditions is poorly understood, and limited studies exist on the LPOs of only naturally deformed chlorite [10,38,54,55,56,57]. Two types of chlorite LPOs have been reported (Figure S1). The chlorite [001] axes align subnormal to the foliation, and the other poles of (110) and (010) are aligned subparallel to the foliation [10,38,54,56]. This structure was defined as the type-1 LPO of chlorite [53]. In contrast, the chlorite [001] axes align not only subnormal to the foliation but also subnormal to the lineation on the foliation [38,55,57], which defines the type-2 LPO of chlorite. The two different types of chlorite LPOs can produce different seismic anisotropy [38] and therefore, the applicability of the chlorite LPO for the interpretation of seismic anisotropy is ambiguous.
In nature, the mode of deformation in the subducting slab is most likely simple shear. Therefore, to understand the development of two different LPOs of chlorite we conducted deformation experiments of chlorite peridotite in simple shear under high P–T conditions, providing the mechanism for the development of the two different types of chlorite LPOs and the resultant seismic anisotropy.
2. Materials and Methods
The starting material was chlorite peridotite (Figure S2) sourced from Almklovdalen, in the Western Gneiss Region, southwest Norway. The chlorite peridotite of starting material showed the bulk composition of olivine (60%), chlorite (31%), orthopyroxene (5%), clinopyroxene (3%), and garnet (1%). The chemical composition of chlorite was clinochlore of composition (Mg4.6Fe2+0.3Cr0.1)Al(Si3Al)O10(OH)8 (Table 1). A JEOL JXA-8900R electron probe micro analyzer (EPMA) at the National Center for Inter-University Research Facilities (NCIRF) at Seoul National University (SNU) was used to analyze chemical composition of the starting material.
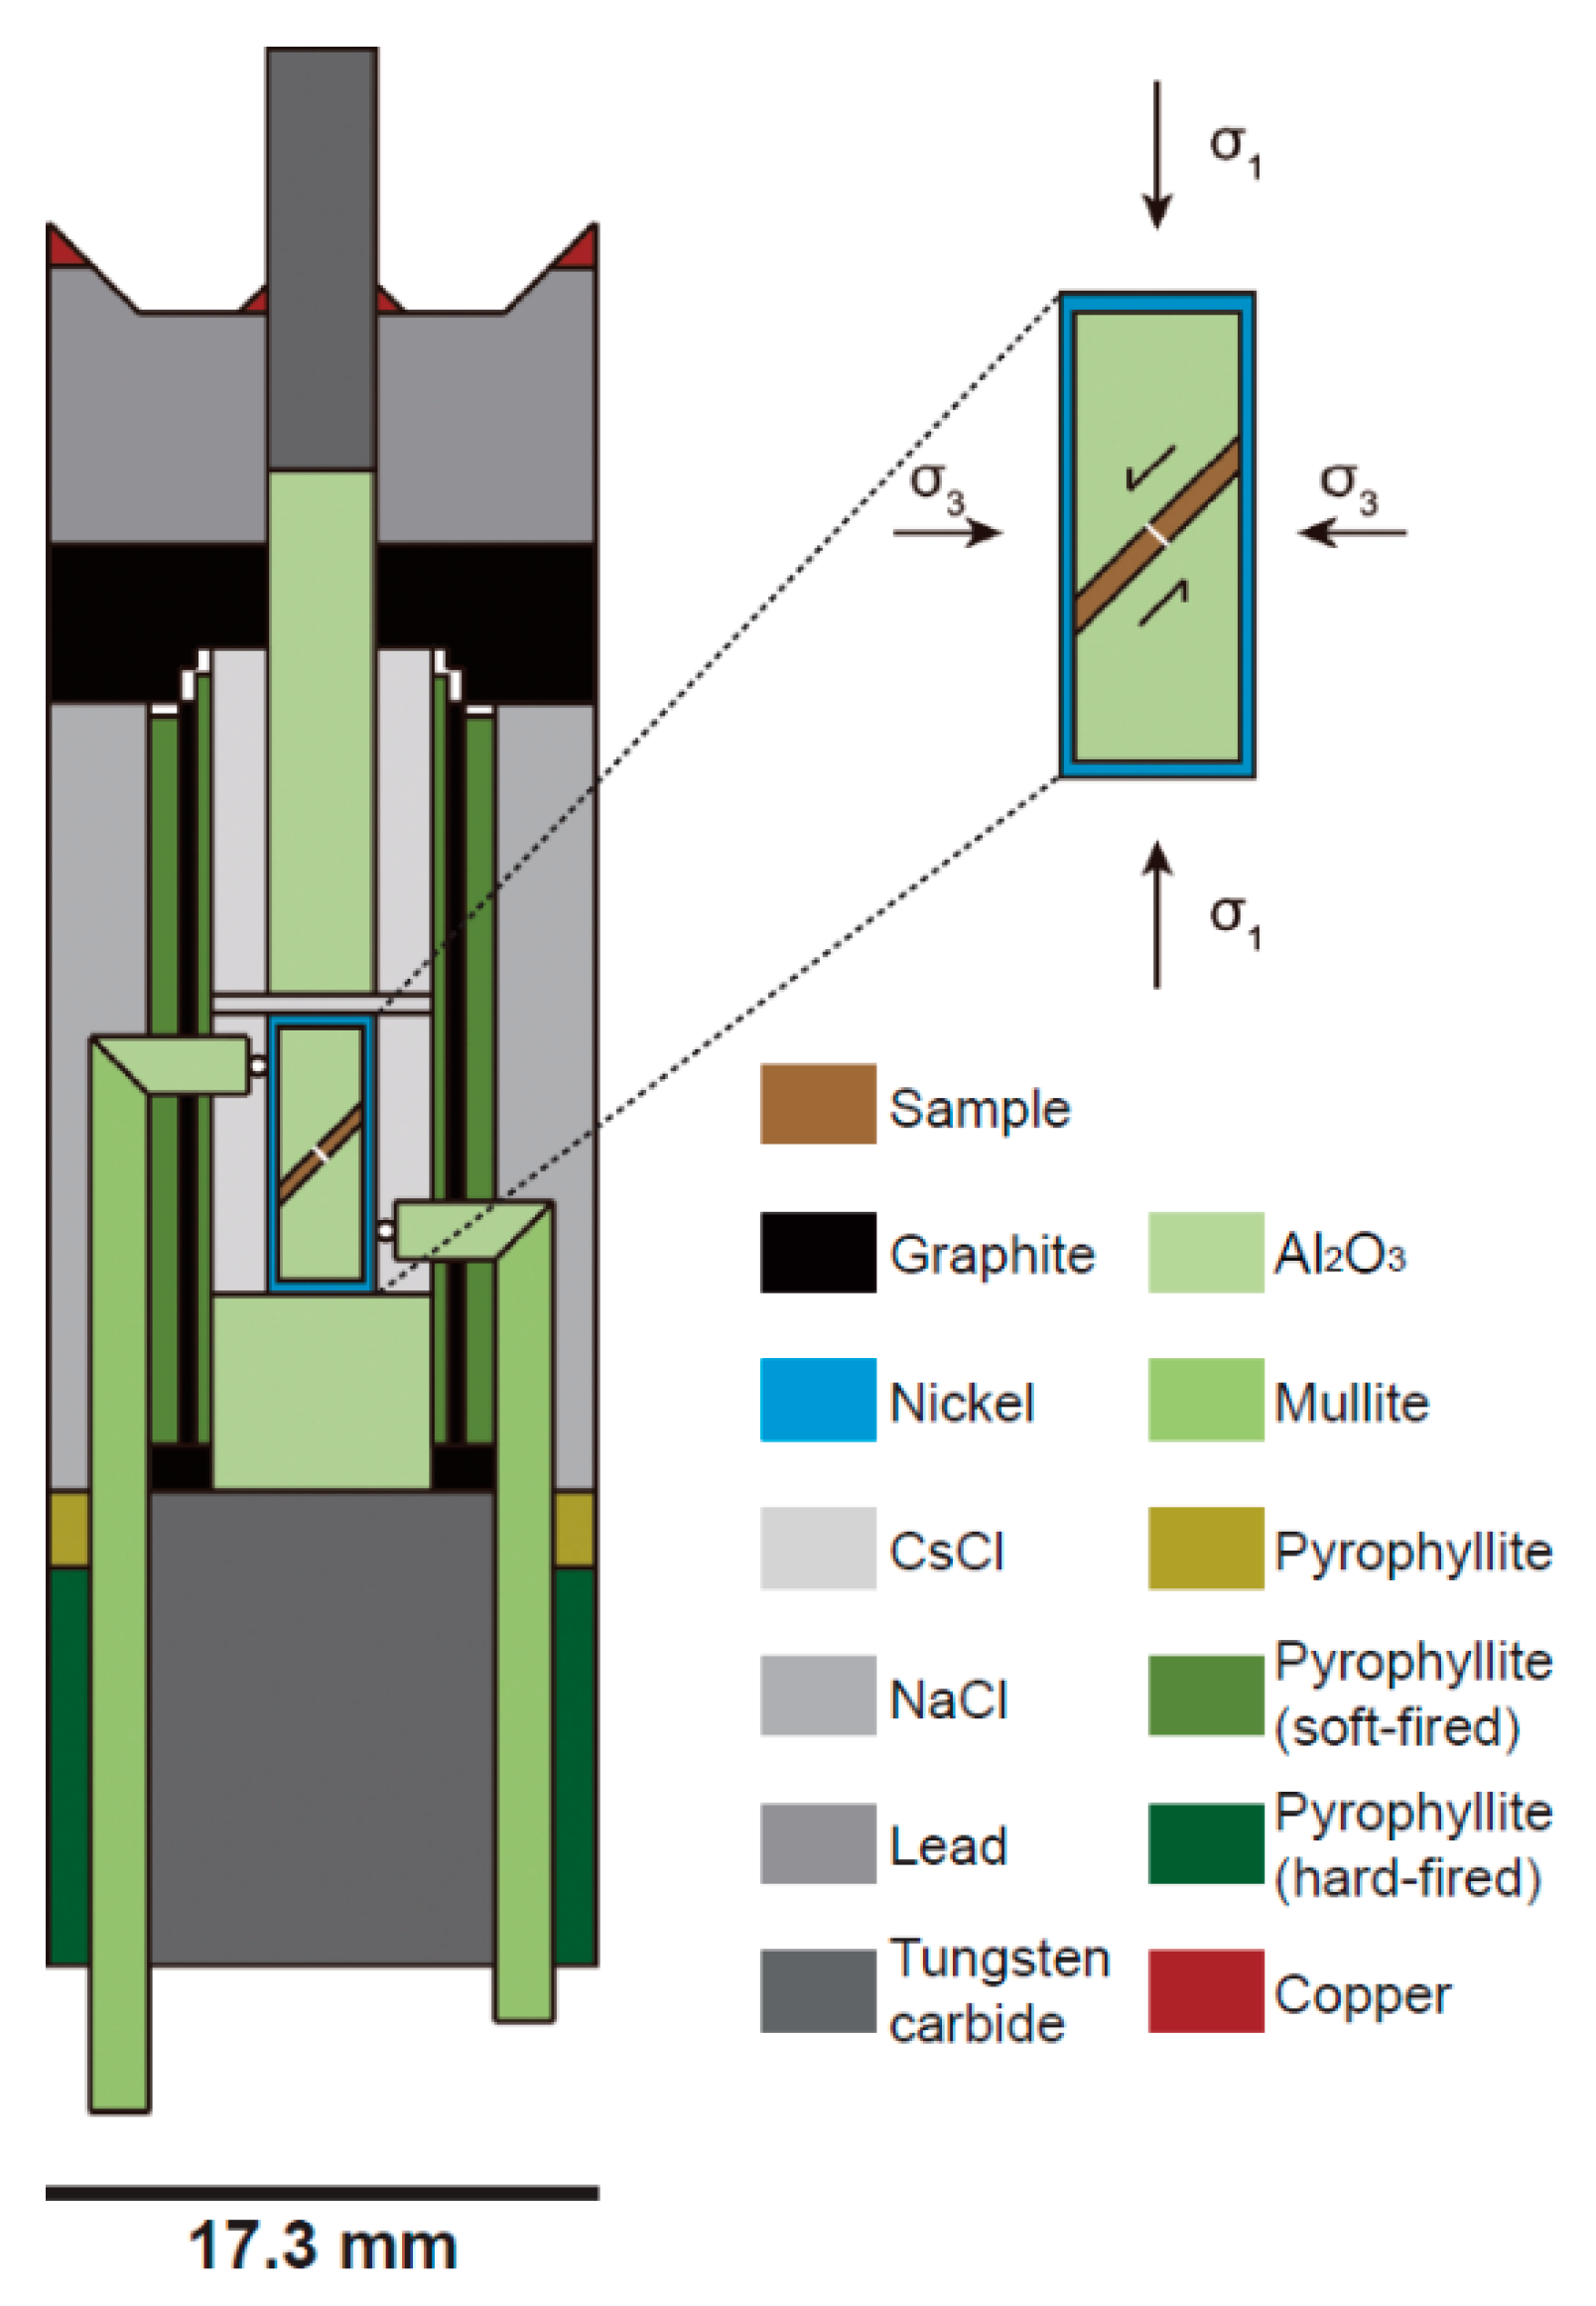
Simple shear experiments were conducted using a modified Griggs apparatus at the Tectonophysics Laboratory, School of Earth and Environmental Sciences (SEES) in SNU. Figure 2 shows the sample assembly. The samples were core-drilled with a diameter of 3.1 mm. Core-drilled sample were cut at 45° to the foliation. The samples were then placed between two alumina pistons inside a nickel capsule, and the foliation of starting material was aligned parallel to σ1 direction to minimize the effect of preexisting chlorite LPO of starting material (Figure 2). Nickel foil was inserted in the middle of the sample—perpendicular to the shear plane—to measure the shear strain. Weak CsCl and NaCl were used as pressure mediums. The temperature was measured by two thermocouples (Pt-30% Rh-70% and Pt-6% Rh-94%). The confining pressure was increased in 12 h and the temperature was increased within 1 h. Samples were deformed under constant strain rates of 2.7–9.7 × 10⁻⁶ s−1 (Table 2). After each deformation experiment, the sample was quenched to room temperature by shutting off the power and decreasing the pressure in 12 h.
Experimental specimens were cut along the x–z plane (x: shear direction, z: normal to the shear plane). They were carefully polished using alumina powders, 1 μm diamond paste, and Syton 0.06 μm colloidal silica for 8 h to remove mechanical damage. The polished sample was observed using a JEOL JSM-7100F field-emission scanning election microscope (FE–SEM) housed at the SEES in SNU. Chlorite grain thickness was measured with the backscattered electron images (BEIs) magnified up to 16,000× using the FE–SEM. The chemical composition of the dehydration products was determined using an energy dispersive spectrometer (EDS) in the JEOL JSM-7100F FE–SEM at the SEES in SNU.
The LPOs of chlorite and olivine were determined using electron backscattered diffraction (EBSD), which was attached to the JEOL JSM-6380 scanning electron microscope (SEM) at SEES. The accelerating voltage was 20 kV and the working distance was 15 mm in the SEM for the EBSD analysis. The HKL EBSD system with channel 5 software was used to index the EBSD patterns. The EBSD patterns of each grain was analyzed manually to ensure correct indexing with a mean angular deviation (MAD) less than 1°. The fabric strength of the LPO was determined using the misorientation index (M-index) [58]. The M-index ranges from 0 (random fabric) to 1 (single crystal or complete alignment). Because of manual analysis for accurate data, the numbers of EBSD data in this study were smaller than those of automated mapping [59,60]. However, according to the previous study [58], minimum number of grains for a meaningful fabric strength and LPO is N = 150. Numbers of grain for EBSD data in this study were over meaningful 150 for each experimental sample.
The seismic anisotropy of chlorite and olivine was calculated from the LPO data of experimentally deformed chlorite and olivine using the ANIS2k and VpG programs from Mainprice [61], using chlorite elastic constants for the P = 1.8 GPa condition from Mookherjee and Mainprice [47]. However, the observed seismic anisotropy in the subduction zone may be caused by the mixture of the LPOs of olivine, chlorite, and serpentine in the path of seismic propagation. Therefore, seismic anisotropy of the mixture of the olivine and chlorite LPOs, and the mixture of the chlorite and serpentine LPOs were calculated, using the olivine elastic constants from Abramson et al. [62] and the serpentine elastic constants from Bezacier, Reynard, Bass, Sanchez-Valle and van de Moortèle [29]. Because of the absence of serpentine in our specimen, we used the LPO data of serpentine (VM3) from previous study [34], which showed a well-defined foliation. In the calculation of seismic properties, we arranged the foliation of serpentine identical to the shear plane of experiments. The ANIS2k and VpG programs were used for the calculation of polyphasic seismic anisotropy, which have been qualified over decades [61]. The delay time (dt) of the S-wave was calculated using the following equation [63]: dt = (0.01 × AVs × T)/<Vs>, where T is the anisotropic layer thickness, <Vs> is the average velocity of the fast and slow shear waves (Vs1 and Vs2, respectively), and AVs is the anisotropy of the S-wave expressed as a percentage.
To understand the stability field of chlorite peridotite in this study we calculated the stability field and the volume percentage of chlorite in the Na2O–CaO–FeO–MgO–Al2O3–SiO2–H2O (NCFMASH) model system using Theriak-Domino software [64] with the database of Holland and Powell [65] (tc55MnNCKFMASH file). Solid solution for the mineral phases includes chlorite [66], olivine [67], antigorite [67], diopside [68], garnet [69], amphibole [70], orthopyroxene [71], phlogopite [67], pargasite [67], brucite [67], hercynite [67], clinohumite [67], monticellite [67], vesuvianite [67], and phase A [67]. The bulk composition was determined by modal composition of starting material and EPMA analysis (Table 1), which is average value of at least three points for each mineral.
3. Results
3.1. Microstructures
The bulk composition of experimental specimens was olivine (60%), chlorite (35%), pyroxene (4%), and other minor components (1%). An example of deformed chlorite peridotite in simple shear at the pressure of P = 2.5 GPa and temperature of T = 540 °C is shown in Figure 3. We did not observe phase change with increasing shear strain at any P–T condition. Chlorite grains became thin and showed very strong shape preferred orientation on every experimental specimen in common. They assembled to form chlorite sheets, which was aligned less than about 30° from the shear direction (Table 2 and Figure 3). Shear strain was localized along the chlorite-rich area. Olivine grains preserved their round shape and had a grain size up to 100 μm (Figure 3a). Most chlorite grains were thinner than 10 μm, and they became much thinner in the sample deformed at high shear strain (Figure 3 and Figure 4).
3.2. The LPOs of Chlorite
The same starting material was used for every experiment in this study, and chlorite LPO of the starting material is shown at the top of Figure 5. The starting material showed the [001] axes of chlorite aligned about 45° from the experimental shear direction, and other axes of chlorite aligned as a girdle subnormal to the [001] axes (Figure 5). The pole figure of the starting material is very much different from the LPOs of experimentally deformed chlorite under the same reference frame (Figure 5). Although the starting material showed initial chlorite fabric, the chlorite LPOs were significantly changed to type-1 LPO of chlorite at the low shear strain (γ ≤ 3.1) and to type-2 LPO at the high shear strain (γ ≥ 5.1) after deformation experiments (Figure 5).
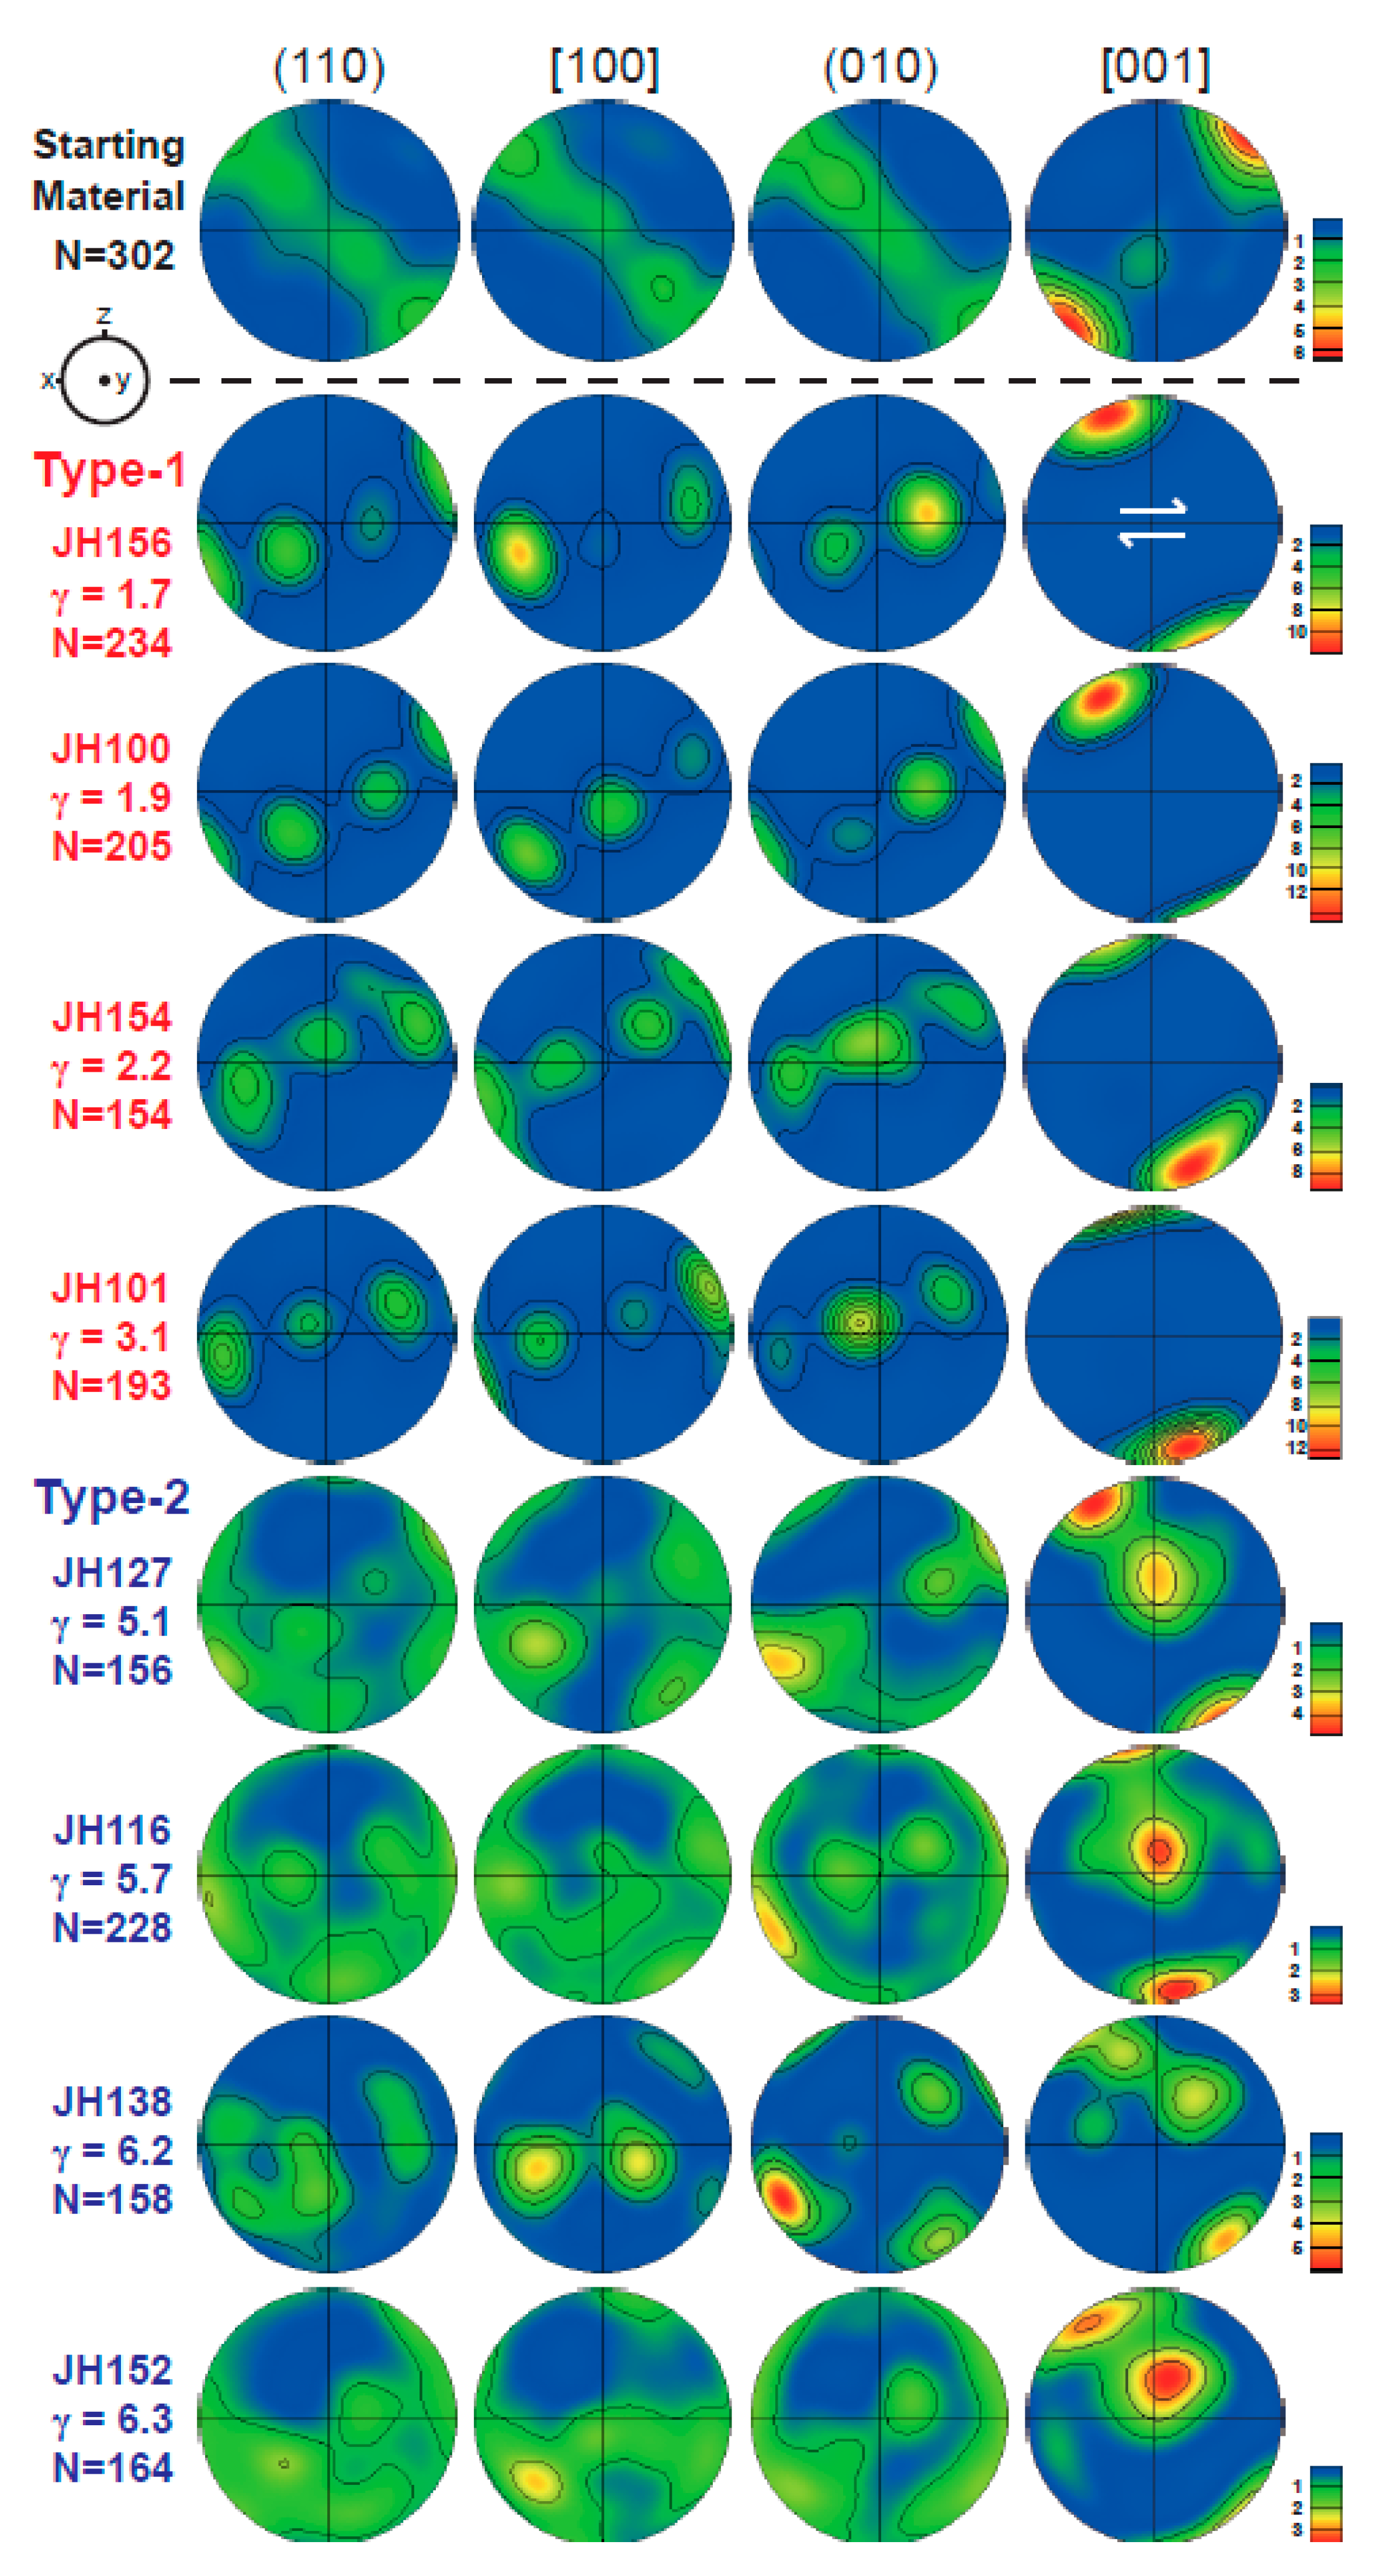
Table 2 shows the experimental conditions and the results of the eight experiments conducted under high P–T conditions (P = 0.5–2.5 GPa, T = 540–720 °C) (Figure 1). Four samples were deformed at low shear strain (γ ≤ 3.1 ± 0.3) and the other four samples were deformed at high shear strain (γ ≥ 5.1 ± 1.5) (Table 2). The resulting chlorite LPOs from all eight experiments are shown in Figure 5. Sample JH156, JH100, JH154, and JH101—deformed at a low shear strain (γ ≤ 3.1)—showed a strong chlorite LPO with the [001] axes aligned subnormal to the shear plane (type-1), indicating a dominant slip system of (001)[hk0]. However, sample JH127, JH116, JH138, and JH152—deformed at a high shear strain (γ ≥ 5.1)—showed the [001] axes of chlorite aligned as a girdle with two high concentrations: subnormal to the shear plane and subnormal to the shear direction on the shear plane (type-2), indicating a dominant slip system of (001)[hk0] and additional pencil-glide slip systems. The two chlorite LPO types were developed depending on the magnitude of shear strain (Table 2 and Figure 5). Regardless of the P–T conditions, samples that were deformed under low shear strain (γ ≤ 3.1 ± 0.3) showed type-1 LPOs, whereas samples under high shear strain (γ ≥ 5.1 ± 1.5) showed type-2 LPOs (Table 2 and Figure 5). Two samples, JH101 and JH116, were deformed under the same P–T conditions (P = 0.5 GPa, T = 650 °C) with different shear strain of γ = 3.1 and 5.7, respectively (Table 2). Sample JH101, under low shear strain, developed a type-1 LPO, whereas sample JH116, under high shear strain, developed a type-2 LPO (Figure 5). The chlorite fabric strength was presented as a M-index [58], which is very strong for type-1 chlorite LPOs (M = 0.479–0.621), and relatively weak for type-2 chlorite LPOs (M = 0.075–0.256) (Table 2). The LPOs of olivine in samples JH156 and JH116 were also measured and are shown in Figure S3a.
3.3. Seismic Anisotropy
The seismic anisotropy of P-wave is defined as (VPH − VPV)/VPV, and that of S-wave is defined as (VSH − VSV)/VSV, where VPH and VPV are the velocities of horizontally and vertically propagating P-waves, and VSH and VSV are the velocities of horizontally and vertically polarized S-waves propagating horizontally [72]. The seismic velocity and anisotropy of all samples are shown in Figure 6. Type-1 chlorite LPOs produced substantially stronger seismic anisotropy than type-2 chlorite LPOs. Sample JH156, JH100, JH154, and JH101 (type-1 chlorite LPOs) produced high values (blue area of Figure 6) for both P-wave velocity and S-wave anisotropy subparallel to the shear plane (x–y plane) (Figure 6). In contrast, sample JH127, JH116, JH138, and JH152 (type-2 chlorite LPOs) produced high P-wave velocity (blue area of Figure 6) subparallel to the shear direction, and high S-wave anisotropy (blue area of Figure 6) distributed along the x–z plane. The maximum seismic anisotropy of type-1 chlorite LPOs (sample JH156, JH100, JH154, and JH101) was very strong: 23.6% for the P-wave and 48.7% for the S-wave (Table 2 and Figure 6). In contrast, the maximum seismic anisotropy of type-2 chlorite LPOs (sample JH127, JH116, JH138, and JH152) was less strong 17.0% for the P-wave and 21.6% for the S-wave (Table 2 and Figure 6). For horizontal shear (θ = 0°), the polarization direction of the fast S-wave (Vs1) was subparallel to flow direction (x-direction) for both chlorite LPO types for the vertically propagating S-wave (z-direction) (Figure 6). We also calculated seismic anisotropy of olivine for the representative two samples. The maximum seismic anisotropy of olivine LPO was 15.7% for the P-wave and 11.2% for the S-wave (Table 3 and Figure S3b). The polarization direction of the fast S-wave in olivine from sample JH156 was subnormal to the flow direction for the vertically propagating S-wave (z-direction) (Figure S3b). For olivine from sample JH116, the polarization direction of the fast S-wave was subparallel to the flow direction (x-direction) (Figure S3b).
4. Discussion
4.1. The LPO Development of Chlorite
Deformation experiments of chlorite peridotite at low shear strain (γ ≤ 3.1 ± 0.3) showed type-1 LPOs of chlorite, whereas those at high shear strain (γ ≥ 5.1 ± 1.5) showed type-2 LPOs of chlorite (Table 2 and Figure 5). These two types of chlorite LPOs are similar to those reported in previous studies of natural samples [10,38,54,55,56,57].
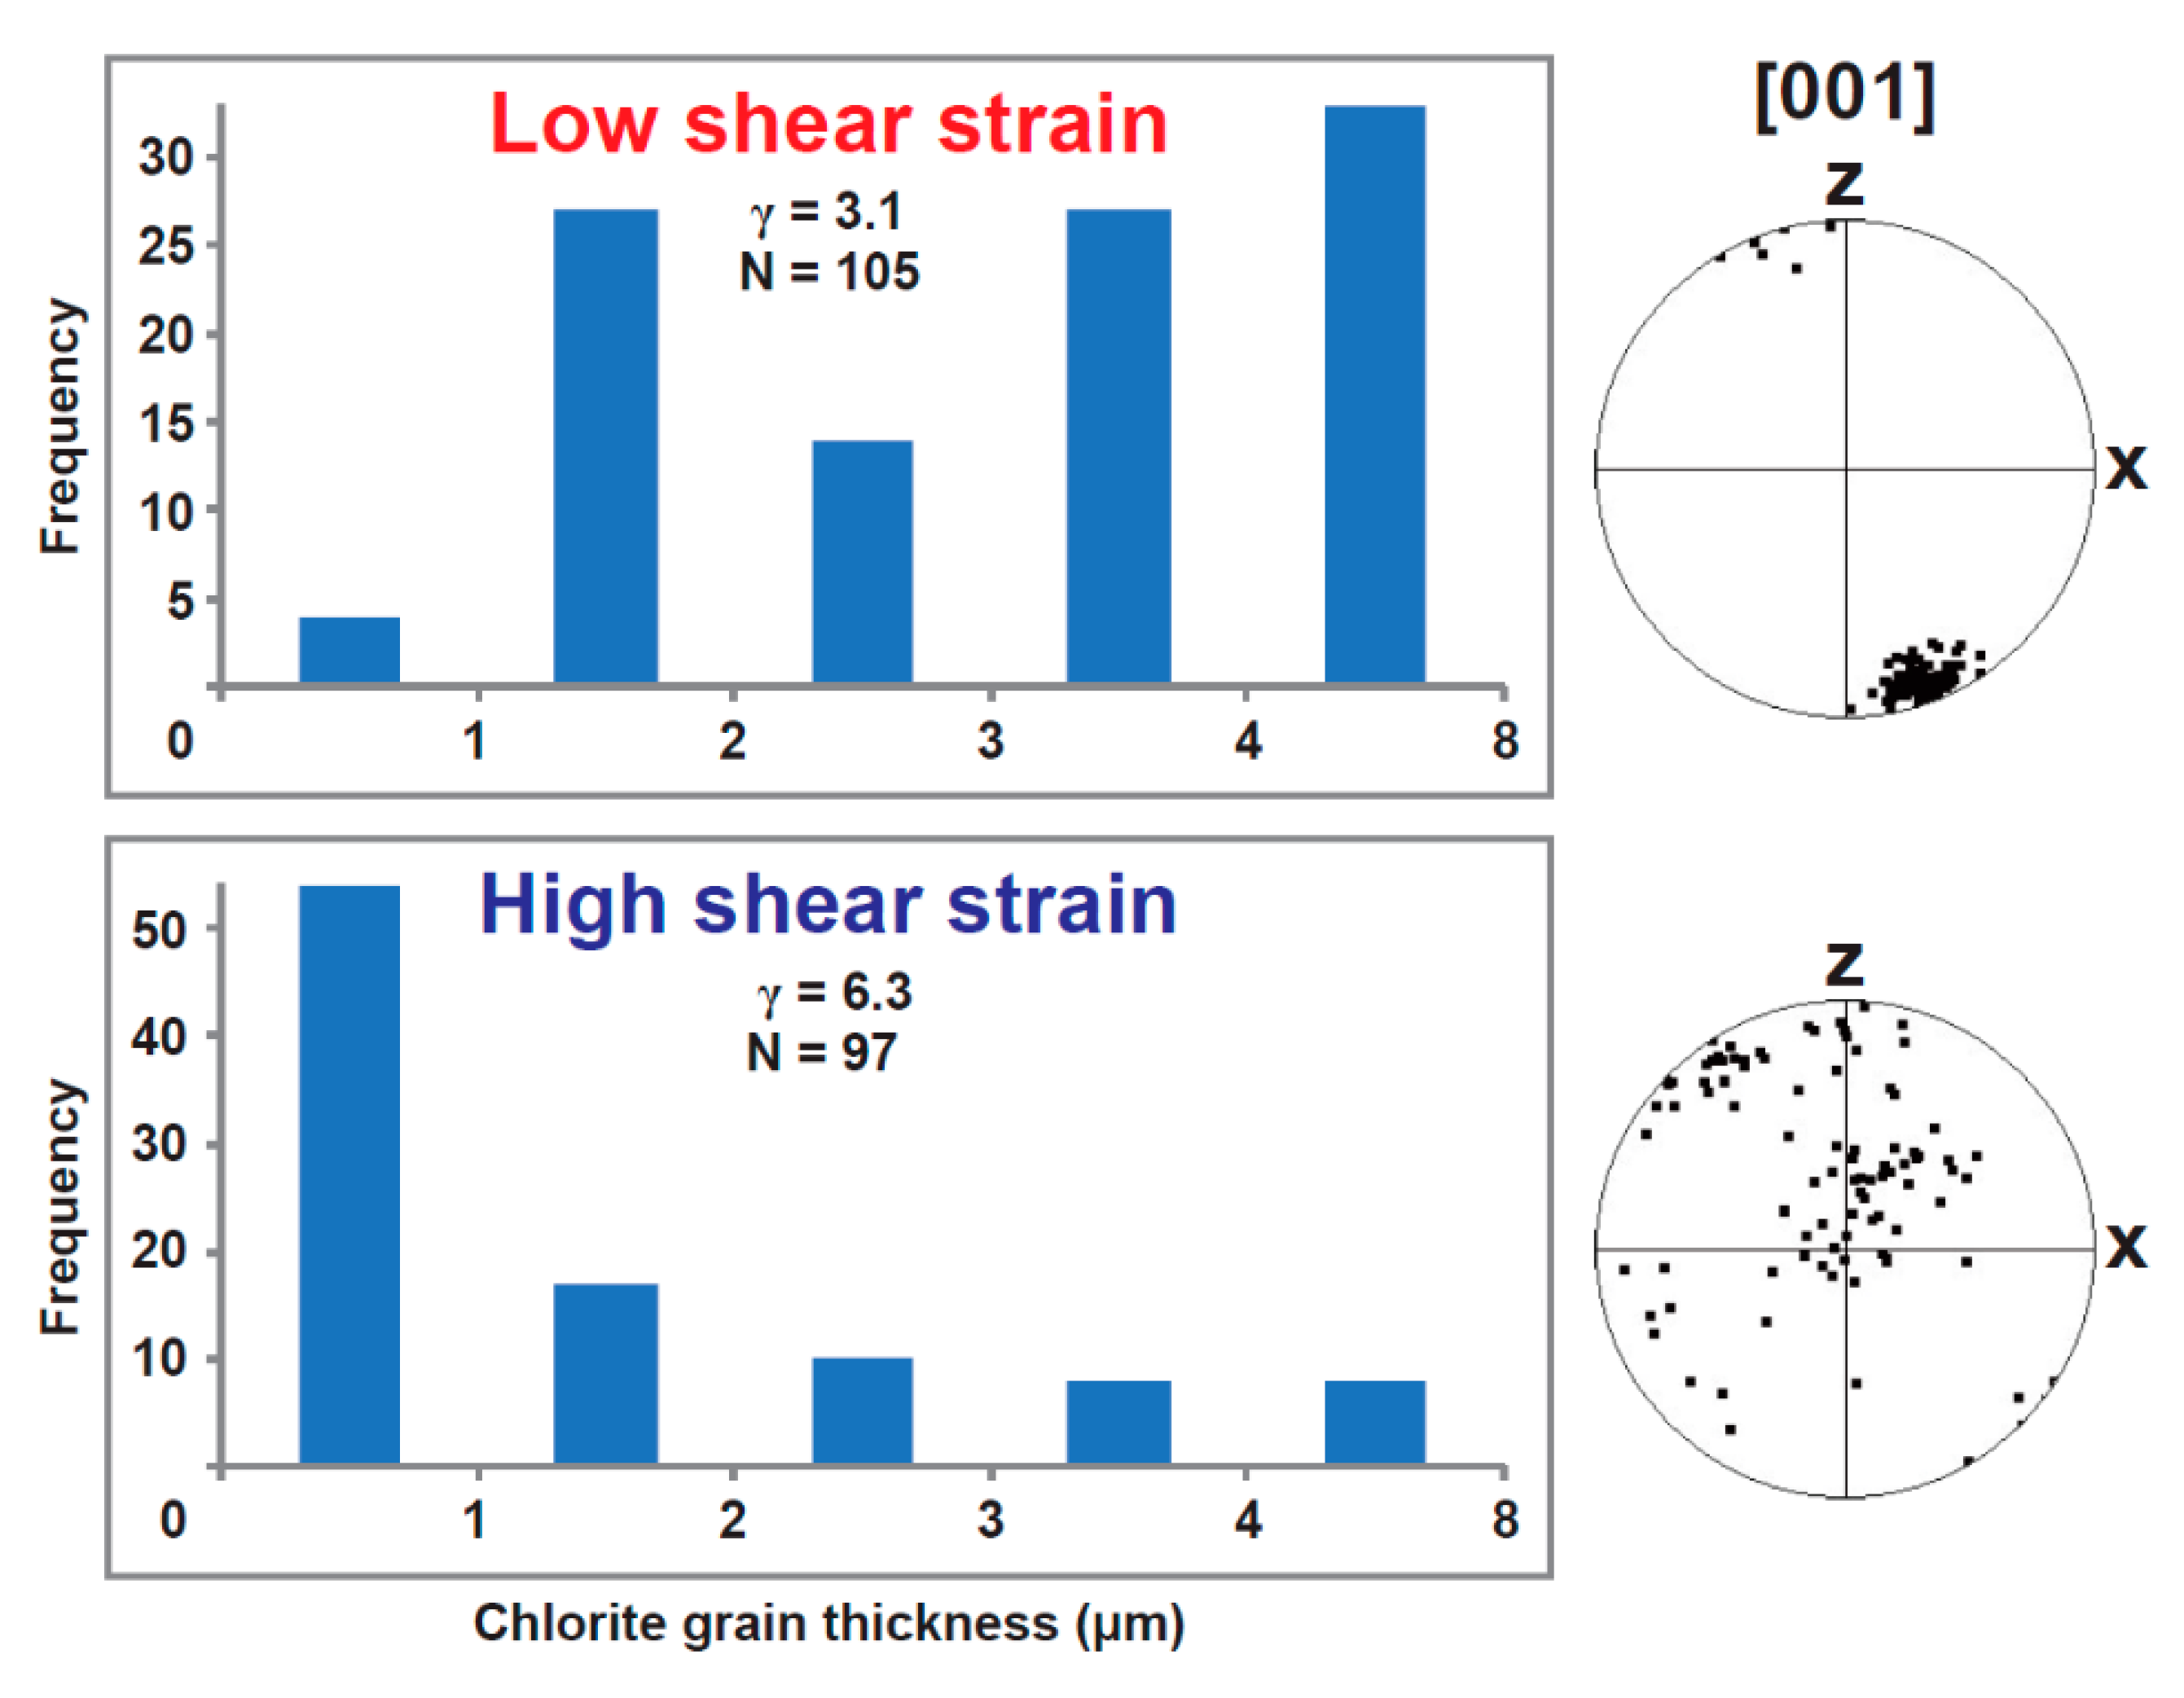
Figure 4 shows the histogram of chlorite grain thickness for two samples at low shear strain (sample JH101, γ = 3.1 ± 0.3) and high shear strain (sample JH152, γ = 6.3 ± 1.6), respectively. The low-shear-strain sample showed a wide range of chlorite grain sizes, whereas the high-shear-strain sample showed a narrow range of chlorite grain sizes. The orientations of chlorite [001] axes were also measured corresponding to the grains. The low-shear-strain sample had predominantly thick chlorite grains (>1 μm) and the [001] axes of chlorite were aligned subnormal to the shear plane (type-1 LPO) (Figure 4). In contrast, the high-shear-strain sample had predominantly thin chlorite grains (≤1 μm) and the [001] axes of the small chlorite grains were aligned subnormal to the shear direction (girdle distribution) with a strong concentration near the center of the pole figure (type-2 LPO) (Figure 4). These LPO results are similar to the pole figures of chlorite in Figure 5 (type-1 and type-2 LPOs). Crystal rotation accompanied by grain size reduction with increasing shear strain may be a possible factor in the development of different chlorite LPOs. The LPO development of small chlorite grains with large shear strain in this study is similar to that of amphibole [73,74], micas [75], wadsleyite [76], and calcite [77]. Kim and Jung [73] have recently conducted deformation experiments of amphibole in simple shear under high P–T conditions (P = 0.5 GPa, T = 500–700 °C). The increased shear strain reduced the grain size of amphibole and the [100] axes of the small grains were distributed as a girdle with a strong concentration near the center of the pole figure, which is characterized as type-IV amphibole LPO [73].
4.2. Implications for Seismic Anisotropy
The maximum seismic anisotropy of the S-wave was up to 48.7% for the type-1 chlorite LPOs, and up to 21.6% for the type-2 chlorite LPOs (Table 2 and Figure 6). Seismic anisotropy of the mixture of the olivine and chlorite LPOs (sample JH156 and JH116), and the mixture of the chlorite and serpentine LPOs (sample JH100 for chlorite and sample VM3 of Jung [34] for serpentine) were calculated (Table 3). The delay time of the S-wave of the mixtures were calculated using the equation of Pera, Mainprice and Burlini [63], for the 5–30 km thick layer of chlorite peridotite [48,49,50]. Although the maximum seismic anisotropy of the S-wave of olivine LPOs was moderate (9.4–11.2%) (Table 3 and Figure S3b), mixing olivine with chlorite (70:30 ratio) increased the maximum seismic anisotropy of the S-wave up to 19.3% (Table 3). The maximum seismic anisotropy of the mixture of chlorite and serpentine LPOs was 28.4–37.6% for the S-wave, which increased continuously with increasing chlorite ratio (Table 3 and Figure 7). The delay time of the S-wave of the mixture of olivine and chlorite LPOs (70:30 ratio) was in the range of 0.2–1.2 s, and that of the mixture of chlorite and serpentine LPOs was up to 0.4–2.4 s, which increased continuously with increasing chlorite ratio (Table 3). The resulting maximum seismic anisotropy and delay time of the S-wave of the mixtures are considered to be sufficiently large to influence seismic anisotropy in subduction zones.
Considering deformation of chlorite in subduction zones where the slab has a dip angle, a type-1 chlorite LPO produces a trench-normal (parallel to the x-direction) Vs1 polarization direction for shallow subducting slab dip angles (θ = 0 and 30°), but a trench-parallel (parallel to the y-direction) Vs1 polarization direction for a large dip angles (θ = 45 and 60°) (Figure 6 and Figure 8). Previous studies of the LPO of deformed chlorite in nature showed a similar result [38]. However, a type-2 chlorite LPO produces a trench-normal Vs1 polarization direction for any dip angle of the subducting slab (Figure 6 and Figure 8). The chlorite fabric transition probably occurs as subduction progresses to increasing levels of shear strain. New chlorites are produced in the mantle wedge under the fore-arc area owing to the dehydration of minerals in the subducting slab. As the new chlorites have not yet experienced a large shear strain in the subduction zone, they can retain the type-1 LPO to a considerable depth. In addition, thick chlorite peridotite at low temperatures in the upper part of the subducting slab under the fore-arc area may experience a low shear strain, producing the type-1 LPO. Therefore, the type-1 chlorite LPO may occur in fore-arc zones with low shear strain, producing trench-parallel seismic anisotropy in the slab and at the lower part of the mantle wedge. The type-2 chlorite LPO may occur in back-arc zones with high shear strain, producing the trench-normal seismic anisotropy observed in back-arc regions [3,6,27,40,41]. As suggested by previous studies, different olivine LPOs may also contribute to the large seismic anisotropy observed in fore-arc and back-arc settings [9,11,12,42,78,79].
4.3. Chlorite Stability in Subduction Zone
Chlorite is stable in the upper part of the subducting slab and chlorite peridotite in the slab can be thick (~5–30 km) depending on the slab temperature [48,49,50]. Chlorite can also be formed in the mantle wedge by the reaction of peridotite with fluid available from the dehydration of minerals in the subducting slab. Kim and Jung [38] reported natural chlorite peridotites exhumed from the subduction zone, which contained up to 35% chlorite. Morales, Mainprice and Boudier [54] reported the presence of ~22% chlorite in erupted mantle fragments, and Alt et al. [80] also reported the presence of ~20% chlorite in chlorite harzburgite which was exhumed from the subduction zone. Lee, Jung, Klemd, Tarling, and Konopelko [39] recently reported the presence of ~30% chlorite in ultrahigh-pressure tectonic mélange from central Asia. Figure 9 is the pseudosection calculated using Theriak-Domino software [64], showing that chlorite peridotite in the subduction zone can contain up to 37% chlorite.
5. Conclusions
High P–T (P = 0.5–2.5 GPa, T = 540–720 °C) deformation experiments of chlorite peridotite revealed two different LPO types of chlorite, which developed depending on the magnitude of the shear strain. The type-1 chlorite LPO was characterized by the [001] axes aligned subnormal to the shear plane and developed under low shear strain (γ ≤ 3.1 ± 0.3). The type-2 chlorite LPO was characterized by a girdle distribution of the [001] axes subnormal to the shear direction and developed under high shear strain (γ ≥ 5.1 ± 1.5). Our data indicate that crystal rotation accompanied by grain size reduction with increasing shear strain possibly causes different LPOs of chlorite. When considering mixtures of chlorite with olivine or serpentine, the strong seismic anisotropy of the S-wave of chlorite LPOs (48.7% for the type-1 chlorite LPO and 21.6% for the type-2 chlorite LPO) can increase those seismic anisotropy of mixtures. We found that the type-1 chlorite LPO could produce trench-parallel seismic anisotropy in the fore-arc zones, whereas the type-2 chlorite LPO could produce trench-normal seismic anisotropy in the back-arc area of subduction zones. Our results suggest that anomalous seismic anisotropy of S-wave in subduction zones can be influenced by a strong chlorite LPO.
Supplementary Materials
The following are available online at https://www.mdpi.com/2075-163X/10/6/503/s1, Figure S1: Pole figures of chlorite observed in natural samples showing two different types of LPOs, Figure S2: Optical photomicrograph of starting material (chlorite peridotite) in cross-polarized light with λ plate inserted, Figure S3: Pole figures and seismic anisotropy of experimentally deformed olivine.
Author Contributions
Conceptualization, H.J.; methodology, H.J., D.K., and J.L.; software, D.K. and J.L.; validation, H.J., D.K., and J.L.; formal analysis, D.K. and J.L.; investigation, D.K.; resources, H.J.; data curation, D.K.; writing—original draft preparation, D.K.; writing—review and editing, H.J.; visualization, D.K. and J.L.; supervision, H.J.; project administration, H.J.; funding acquisition, H.J. All authors have read and agreed to the published version of the manuscript.
Funding
This research was funded by the National Research Foundation of Korea (NRF: 2020R1A2C2003765) to H.J.
Acknowledgments
The authors are grateful to three anonymous reviewers, whose suggestions and comments have notably improved the manuscript. We thank Håkon Austrheim for his assistance in collecting starting material (chlorite peridotite) for the experiments.
Conflicts of Interest
The authors declare no conflict of interest.
References
- Long, M.D. Constraints on subduction geodynamics from seismic anisotropy. Rev. Geophys. 2013, 51, 76–112. [Google Scholar] [CrossRef]
- Long, M.D.; Silver, P.G. The subduction zone flow field from seismic anisotropy: A global view. Science 2008, 319, 315–318. [Google Scholar] [CrossRef] [PubMed] [Green Version]
- Nakajima, J.; Hasegawa, A. Shear-wave polarization anisotropy and subduction-induced flow in the mantle wedge of northeastern Japan. Earth Planet. Sci. Lett. 2004, 225, 365–377. [Google Scholar] [CrossRef]
- Park, J.; Levin, V. Seismic anisotropy: Tracing plate dynamics in the mantle. Science 2002, 296, 485–489. [Google Scholar] [CrossRef] [Green Version]
- Savage, M.K. Seismic anisotropy and mantle deformation: What have we learned from shear wave splitting? Rev. Geophys. 1999, 37, 65–106. [Google Scholar] [CrossRef]
- Smith, G.P.; Wiens, D.A.; Fischer, K.M.; Dorman, L.M.; Webb, S.C.; Hildebrand, J.A. A complex pattern of mantle flow in the Lau backarc. Science 2001, 292, 713–716. [Google Scholar] [CrossRef] [Green Version]
- Schulte-Pelkum, V.; Monsalve, G.; Sheehan, A.; Pandey, M.R.; Sapkota, S.; Bilham, R.; Wu, F. Imaging the Indian subcontinent beneath the Himalaya. Nature 2005, 435, 1222–1225. [Google Scholar] [CrossRef]
- Behr, W.M.; Smith, D. Deformation in the mantle wedge associated with Laramide flat-slab subduction. Geochem. Geophys. Geosyst. 2016, 17, 2643–2660. [Google Scholar] [CrossRef] [Green Version]
- Jung, H.; Karato, S.-I. Water-induced fabric transitions in olivine. Science 2001, 293, 1460–1463. [Google Scholar] [CrossRef] [Green Version]
- Kang, H.; Jung, H. Lattice-preferred orientation of amphibole, chlorite, and olivine found in hydrated mantle peridotites from Bjørkedalen, southwestern Norway, and implications for seismic anisotropy. Tectonophysics 2019, 750, 137–152. [Google Scholar] [CrossRef]
- Karato, S.-I.; Jung, H.; Katayama, I.; Skemer, P. Geodynamic significance of seismic anisotropy of the upper mantle: New insights from laboratory studies. Annu. Rev. Earth Planet. Sci. 2008, 36, 59–95. [Google Scholar] [CrossRef] [Green Version]
- Katayama, I.; Karato, S.-I. Effect of temperature on the B-to C-type olivine fabric transition and implication for flow pattern in subduction zones. Phys. Earth Planet. Inter. 2006, 157, 33–45. [Google Scholar] [CrossRef]
- Kneller, E.A.; van Keken, P.E.; Katayama, I.; Karato, S.-I. Stress, strain, and B-type olivine fabric in the fore-arc mantle: Sensitivity tests using high-resolution steady-state subduction zone models. J. Geophys. Res. Solid Earth 2007, 112. [Google Scholar] [CrossRef] [Green Version]
- Long, M.D.; Silver, P.G. Shear wave splitting and mantle anisotropy: Measurements, interpretations, and new directions. Surv. Geophys. 2009, 30, 407–461. [Google Scholar] [CrossRef] [Green Version]
- Michibayashi, K.; Tasaka, M.; Ohara, Y.; Ishii, T.; Okamoto, A.; Fryer, P. Variable microstructure of peridotite samples from the southern Mariana Trench: Evidence of a complex tectonic evolution. Tectonophysics 2007, 444, 111–118. [Google Scholar] [CrossRef] [Green Version]
- Mizukami, T.; Wallis, S.R.; Yamamoto, J. Natural examples of olivine lattice preferred orientation patterns with a flow-normal a-axis maximum. Nature 2004, 427, 432–436. [Google Scholar] [CrossRef]
- Ohuchi, T.; Kawazoe, T.; Nishihara, Y.; Nishiyama, N.; Irifune, T. High pressure and temperature fabric transitions in olivine and variations in upper mantle seismic anisotropy. Earth Planet. Sci. Lett. 2011, 304, 55–63. [Google Scholar] [CrossRef]
- Park, Y.; Jung, H. Deformation microstructures of olivine and pyroxene in mantle xenoliths in Shanwang, eastern China, near the convergent plate margin, and implications for seismic anisotropy. Int. Geol. Rev. 2015, 57, 629–649. [Google Scholar] [CrossRef]
- Skemer, P.; Katayama, I.; Karato, S.-I. Deformation fabrics of the Cima di Gagnone peridotite massif, Central Alps, Switzerland: Evidence of deformation at low temperatures in the presence of water. Contrib. Mineral. Petrol. 2006, 152, 43–51. [Google Scholar] [CrossRef]
- Tasaka, M.; Michibayashi, K.; Mainprice, D. B-type olivine fabrics developed in the fore-arc side of the mantle wedge along a subducting slab. Earth Planet. Sci. Lett. 2008, 272, 747–757. [Google Scholar] [CrossRef] [Green Version]
- Wang, J.; Zhao, D. P-wave tomography for 3-D radial and azimuthal anisotropy of Tohoku and Kyushu subduction zones. Geophys. J. Int. 2013, 193, 1166–1181. [Google Scholar] [CrossRef]
- Cao, Y.; Jung, H.; Song, S. Olivine fabrics and tectonic evolution of fore-arc mantles: A natural perspective from the Songshugou dunite and harzburgite in the Qinling orogenic belt, central China. Geochem. Geophys. Geosyst. 2017, 18, 907–934. [Google Scholar] [CrossRef]
- Jung, H.; Mo, W.; Green, H.W. Upper mantle seismic anisotropy resulting from pressure-induced slip transition in olivine. Nat. Geosci. 2009, 2, 73. [Google Scholar] [CrossRef]
- Lee, J.; Jung, H. Lattice-preferred orientation of olivine found in diamond-bearing garnet peridotites in Finsch, South Africa and implications for seismic anisotropy. J. Struct. Geol. 2015, 70, 12–22. [Google Scholar] [CrossRef] [Green Version]
- Faccenda, M.; Burlini, L.; Gerya, T.V.; Mainprice, D. Fault-induced seismic anisotropy by hydration in subducting oceanic plates. Nature 2008, 455, 1097. [Google Scholar] [CrossRef]
- Russo, R.M.; Silver, P.G. Trench-parallel flow beneath the Nazca plate from seismic anisotropy. Science 1994, 263, 1105–1111. [Google Scholar] [CrossRef]
- Fischer, K.M.; Fouch, M.J.; Wiens, D.A.; Boettcher, M.S. Anisotropy and flow in Pacific subduction zone back-arcs. In Geodynamics of Lithosphere & Earth’s Mantle; Springer: Berlin/Heidelberg, Germany, 1998; pp. 463–475. [Google Scholar]
- Peyton, V.; Levin, V.; Park, J.; Brandon, M.; Lees, J.; Gordeev, E.; Ozerov, A. Mantle flow at a slab edge: Seismic anisotropy in the Kamchatka region. Geophys. Res. Lett. 2001, 28, 379–382. [Google Scholar] [CrossRef] [Green Version]
- Bezacier, L.; Reynard, B.; Bass, J.D.; Sanchez-Valle, C.; van de Moortèle, B. Elasticity of antigorite, seismic detection of serpentinites, and anisotropy in subduction zones. Earth Planet. Sci. Lett. 2010, 289, 198–208. [Google Scholar] [CrossRef]
- Boudier, F.; Baronnet, A.; Mainprice, D. Serpentine mineral replacements of natural olivine and their seismic implications: Oceanic lizardite versus subduction-related antigorite. J. Petrol. 2010, 51, 495–512. [Google Scholar] [CrossRef]
- Brownlee, S.J.; Hacker, B.R.; Harlow, G.E.; Seward, G. Seismic signatures of a hydrated mantle wedge from antigorite crystal-preferred orientation (CPO). Earth Planet. Sci. Lett. 2013, 375, 395–407. [Google Scholar] [CrossRef]
- Hirauchi, K.-I.; Michibayashi, K.; Ueda, H.; Katayama, I. Spatial variations in antigorite fabric across a serpentinite subduction channel: Insights from the Ohmachi Seamount, Izu-Bonin frontal arc. Earth Planet. Sci. Lett. 2010, 299, 196–206. [Google Scholar] [CrossRef] [Green Version]
- Ji, S.; Li, A.; Wang, Q.; Long, C.; Wang, H.; Marcotte, D.; Salisbury, M. Seismic velocities, anisotropy, and shear-wave splitting of antigorite serpentinites and tectonic implications for subduction zones. J. Geophys. Res. Solid Earth 2013, 118, 1015–1037. [Google Scholar] [CrossRef]
- Jung, H. Seismic anisotropy produced by serpentine in mantle wedge. Earth Planet. Sci. Lett. 2011, 307, 535–543. [Google Scholar] [CrossRef]
- Katayama, I.; Hirauchi, K.-I.; Michibayashi, K.; Ando, J.-I. Trench-parallel anisotropy produced by serpentine deformation in the hydrated mantle wedge. Nature 2009, 461, 1114. [Google Scholar] [CrossRef] [Green Version]
- Nishii, A.; Wallis, S.R.; Mizukami, T.; Michibayashi, K. Subduction related antigorite CPO patterns from forearc mantle in the Sanbagawa belt, southwest Japan. J. Struct. Geol. 2011, 33, 1436–1445. [Google Scholar] [CrossRef]
- Watanabe, T.; Shirasugi, Y.; Yano, H.; Michibayashi, K. Seismic velocity in antigorite-bearing serpentinite mylonites. Geol. Soc. Lond. Spec. Publ. 2011, 360, 97–112. [Google Scholar] [CrossRef]
- Kim, D.; Jung, H. Deformation microstructures of olivine and chlorite in chlorite peridotites from Almklovdalen in the Western Gneiss Region, southwest Norway, and implications for seismic anisotropy. Int. Geol. Rev. 2015, 57, 650–668. [Google Scholar] [CrossRef]
- Lee, J.; Jung, H.; Klemd, R.; Tarling, M.S.; Konopelko, D. Lattice preferred orientation of talc and implications for seismic anisotropy in subduction zones. Earth Planet. Sci. Lett. 2020, 537, 116178. [Google Scholar] [CrossRef]
- Huang, Z.; Zhao, D.; Wang, L. Shear wave anisotropy in the crust, mantle wedge, and subducting Pacific slab under northeast Japan. Geochem. Geophys. Geosyst. 2011, 12. [Google Scholar] [CrossRef]
- Huang, Z.; Zhao, D.; Wang, L. Frequency-dependent shear-wave splitting and multilayer anisotropy in northeast Japan. Geophys. Res. Lett. 2011, 38. [Google Scholar] [CrossRef]
- Kneller, E.A.; van Keken, P.E.; Karato, S.-I.; Park, J. B-type olivine fabric in the mantle wedge: Insights from high-resolution non-Newtonian subduction zone models. Earth Planet. Sci. Lett. 2005, 237, 781–797. [Google Scholar] [CrossRef]
- Long, M.D.; van der Hilst, R.D. Shear wave splitting from local events beneath the Ryukyu arc: Trench-parallel anisotropy in the mantle wedge. Phys. Earth Planet. Inter. 2006, 155, 300–312. [Google Scholar] [CrossRef] [Green Version]
- McCormack, K.; Wirth, E.A.; Long, M.D. B-type olivine fabric and mantle wedge serpentinization beneath the Ryukyu arc. Geophys. Res. Lett. 2013, 40, 1697–1702. [Google Scholar] [CrossRef]
- Wagner, L.S.; Fouch, M.J.; James, D.E.; Long, M.D. The role of hydrous phases in the formation of trench parallel anisotropy: Evidence from Rayleigh waves in Cascadia. Geophys. Res. Lett. 2013, 40, 2642–2646. [Google Scholar] [CrossRef]
- Mainprice, D.; Ildefonse, B. Seismic anisotropy of subduction zone minerals–contribution of hydrous phases. In Subduction Zone Geodynamics; Springer: Berlin, Germany, 2009; pp. 63–84. [Google Scholar]
- Mookherjee, M.; Mainprice, D. Unusually large shear wave anisotropy for chlorite in subduction zone settings. Geophys. Res. Lett. 2014, 41, 1506–1513. [Google Scholar] [CrossRef] [Green Version]
- Fumagalli, P.; Poli, S. Experimentally determined phase relations in hydrous peridotites to 65 GPa and their consequences on the dynamics of subduction zones. J. Petrol. 2005, 46, 555–578. [Google Scholar] [CrossRef]
- Hacker, B.R.; Peacock, S.M.; Abers, G.A.; Holloway, S.D. Subduction factory 2. Are intermediate-depth earthquakes in subducting slabs linked to metamorphic dehydration reactions? J. Geophys. Res. Solid Earth 2003, 108. [Google Scholar] [CrossRef] [Green Version]
- Schmidt, M.W.; Poli, S. Experimentally based water budgets for dehydrating slabs and consequences for arc magma generation. Earth Planet. Sci. Lett. 1998, 163, 361–379. [Google Scholar] [CrossRef]
- Van Keken, P.E.; Hacker, B.R.; Syracuse, E.M.; Abers, G.A. Subduction factory: 4. Depth-dependent flux of H2O from subducting slabs worldwide. J. Geophys. Res. Solid Earth 2011, 116. [Google Scholar] [CrossRef] [Green Version]
- Wada, I.; Behn, M.D.; Shaw, A.M. Effects of heterogeneous hydration in the incoming plate, slab rehydration, and mantle wedge hydration on slab-derived H2O flux in subduction zones. Earth Planet. Sci. Lett. 2012, 353, 60–71. [Google Scholar] [CrossRef]
- Jung, H. Crystal preferred orientations of olivine, orthopyroxene, serpentine, chlorite, and amphibole, and implications for seismic anisotropy in subduction zones: A review. Geosci. J. 2017, 21, 985–1011. [Google Scholar] [CrossRef]
- Morales, L.F.G.; Mainprice, D.; Boudier, F. The influence of hydrous phases on the microstructure and seismic properties of a hydrated mantle rock. Tectonophysics 2013, 594, 103–117. [Google Scholar] [CrossRef]
- Padrón-Navarta, J.A.; Tommasi, A.; Garrido, C.J.; Mainprice, D. On topotaxy and compaction during antigorite and chlorite dehydration: An experimental and natural study. Contrib. Mineral. Petrol. 2015, 169, 1–20. [Google Scholar] [CrossRef]
- Puelles, P.; Gil Ibarguchi, J.I.; Beranoaguirre, A.; Ábalos, B. Mantle wedge deformation recorded by high-temperature peridotite fabric superposition and hydrous retrogression (Limo massif, Cabo Ortegal, NW Spain). Int. J. Earth Sci. 2012, 101, 1835–1853. [Google Scholar] [CrossRef]
- Wallis, D.; Lloyd, G.E.; Phillips, R.J.; Parsons, A.J.; Walshaw, R.D. Low effective fault strength due to frictional-viscous flow in phyllonites, Karakoram Fault Zone, NW India. J. Struct. Geol. 2015, 77, 45–61. [Google Scholar] [CrossRef] [Green Version]
- Skemer, P.; Katayama, I.; Jiang, Z.; Karato, S.-I. The misorientation index: Development of a new method for calculating the strength of lattice-preferred orientation. Tectonophysics 2005, 411, 157–167. [Google Scholar] [CrossRef]
- Park, M.; Jung, H. Analysis of electron backscattered diffraction (EBSD) mapping of geological materials: Precautions for reliably collecting and interpreting data on petro-fabric and seismic anisotropy. Geosci. J. 2020. [Google Scholar] [CrossRef]
- Cao, Y.; Du, J.; Park, M.; Jung, S.; Park, Y.; Kim, D.; Choi, S.; Jung, H.; Austrheim, H. Metastability and nondislocation-based deformation mechanisms of the Flem eclogite in the Western Gneiss Region, Norway. J. Geophys. Res. Solid Earth 2020, 125, e2020JB019375. [Google Scholar] [CrossRef]
- Mainprice, D. A FORTRAN program to calculate seismic anisotropy from the lattice preferred orientation of minerals. Comput. Geosci. 1990, 16, 385–393. [Google Scholar] [CrossRef]
- Abramson, E.H.; Brown, J.M.; Slutsky, L.J.; Zaug, J. The elastic constants of San Carlos olivine to 17 GPa. J. Geophys. Res. Solid Earth 1997, 102, 12253–12263. [Google Scholar] [CrossRef]
- Pera, E.; Mainprice, D.; Burlini, L. Anisotropic seismic properties of the upper mantle beneath the Torre Alfina area (Northern Apennines, Central Italy). Tectonophysics 2003, 370, 11–30. [Google Scholar] [CrossRef]
- De Capitani, C.; Petrakakis, K. The computation of equilibrium assemblage diagrams with Theriak/Domino software. Am. Mineral. 2010, 95, 1006–1016. [Google Scholar] [CrossRef]
- Holland, T.J.B.; Powell, R. An improved and extended internally consistent thermodynamic dataset for phases of petrological interest, involving a new equation of state for solids. J. Metamorph. Geol. 2011, 29, 333–383. [Google Scholar] [CrossRef]
- Holland, T.J.B.; Baker, J.; Powell, R. Mixing properties and activity-composition relationships of chlorites in the system MgO-FeO-Al2O3-SiO2-H2O. Eur. J. Mineral. 1998, 10, 395–406. [Google Scholar] [CrossRef]
- Holland, T.J.B.; Powell, R. An internally consistent thermodynamic data set for phases of petrological interest. J. Metamorph. Geol. 1998, 16, 309–343. [Google Scholar] [CrossRef]
- Holland, T.J.B.; Powell, R. Thermodynamics of order-disorder in minerals; II, symmetric formalism applied to solid solutions. Am. Mineral. 1996, 81, 1425–1437. [Google Scholar] [CrossRef]
- White, R.W.; Powell, R.; Holland, T.J.B. Progress relating to calculation of partial melting equilibria for metapelites. J. Metamorph. Geol. 2007, 25, 511–527. [Google Scholar] [CrossRef]
- Diener, J.F.A.; Powell, R. Revised activity–composition models for clinopyroxene and amphibole. J. Metamorph. Geol. 2012, 30, 131–142. [Google Scholar] [CrossRef]
- Powell, R.; Holland, T.J.B. Relating formulations of the thermodynamics of mineral solid solutions; activity modeling of pyroxenes, amphiboles, and micas. Am. Mineral. 1999, 84, 1–14. [Google Scholar] [CrossRef]
- Mainprice, D. Seismic anisotropy of the deep earth from a mineral and rock physics perspective. In Treatise on Geophysics; Elsevier: Amsterdam, The Netherlands, 2015; pp. 487–538. [Google Scholar]
- Kim, J.; Jung, H. New crystal preferred orientation (CPO) of amphibole experimentally found in simple shear. Geophys. Res. Lett. 2019, 46, 12996–13005. [Google Scholar] [CrossRef] [Green Version]
- Zucali, M.; Barberini, V.; Voltolini, M.; Ouladdiaf, B.; Chateigner, D.; Mancini, L.; Lutterotti, L. Quantitative 3D microstructural analysis of naturally deformed amphibolite from the Southern Alps (Italy): Microstructures, CPO and seismic anisotropy from a fossil extensional margin. In Rock Deformation from Field, Experiments and Theory: A Volume in Honour of Ernie Rutter; Geological Society of London: London, UK, 2015; Volume 409, pp. 201–222. [Google Scholar]
- Wenk, H.-R.; Kanitpanyacharoen, W.; Voltolini, M. Preferred orientation of phyllosilicates: Comparison of fault gouge, shale and schist. J. Struct. Geol. 2010, 32, 478–489. [Google Scholar] [CrossRef]
- Tommasi, A.; Mainprice, D.; Cordier, P.; Thoraval, C.; Couvy, H. Strain-induced seismic anisotropy of wadsleyite polycrystals and flow patterns in the mantle transition zone. J. Geophys. Res. Solid Earth 2004, 109. [Google Scholar] [CrossRef]
- Zucali, M.; Chateigner, D. Crystallographic and seismic anisotropies of calcite at different depths: A study using quantitative texture analysis by neutron diffraction. Minerals 2020, 10, 26. [Google Scholar] [CrossRef] [Green Version]
- Jung, H.; Katayama, I.; Jiang, Z.; Hiraga, T.; Karato, S.-I. Effect of water and stress on the lattice-preferred orientation of olivine. Tectonophysics 2006, 421, 1–22. [Google Scholar] [CrossRef]
- Jung, S.; Jung, H.; Austrheim, H. Microstructural evolution of amphibole peridotites in Åheim, Norway, and the implications for seismic anisotropy in the mantle wedge. Minerals 2020, 10, 345. [Google Scholar] [CrossRef] [Green Version]
- Alt, J.C.; Garrido, C.J.; Shanks, W.C.; Turchyn, A.; Padrón-Navarta, J.A.; López Sánchez-Vizcaíno, V.; Gómez-Pugnaire, M.T.; Marchesi, C. Recycling of water, carbon, and sulfur during subduction of serpentinites: A stable isotope study of Cerro del Almirez, Spain. Earth Planet. Sci. Lett. 2012, 327, 50–60. [Google Scholar] [CrossRef]
Figure 1.
Chlorite stability field in subduction zones. Stability field of chlorite (blue area) and serpentine (red line) in subduction zones (modified after Schmidt and Poli [50]). The green line represents the top of the subducting slab and the dashed lines are isotherms. Black arrow indicates the flow line in the mantle wedge. Blue bars at the top represent the polarization directions of the fast S-wave, showing trench-parallel or trench-normal seismic anisotropy observed in subduction zones [1,2,3,4,5,6,27]. Black and red stars indicate the experimental conditions in this study. Chl: chlorite; Srp: serpentine.

Figure 2.
Sample assembly for deformation experiments of chlorite peridotite. Deformation experiments were conducted in simple shear using a modified Griggs apparatus under high pressure–temperature conditions. Nickel foil was inserted in the middle of the sample—perpendicular to the shear plane—to measure the shear strain. σ1 and σ3 represent the maximum and minimum principal stresses, respectively.

Figure 3.
Backscattered electron images of deformed sample. (a) Backscattered electron image (BEI) of experimentally deformed chlorite peridotite (sample JH156) at P = 2.5 GPa and T = 540 °C (red star in Figure 1), taken with an acceleration voltage of 15 kV and a working distance of 10 mm using the JEOL JSM-7100F field-emission scanning electron microscope (FE–SEM). (b) Magnified view of the black box in (a), showing deformed chlorites. Horizontal black arrows indicate the dextral shear direction of the experiment. Chl: chlorite; Ol: olivine.

Figure 4.
Chlorite grain thickness of two different LPO types of chlorite. Chlorite grain thickness histogram and corresponding pole figures of chlorite [001] axes presented in the lower hemisphere using an equal-area projection. Thickness of 105 chlorite grains of low-shear-strain experiment (sample JH101) and 97 chlorite grains of high-shear-strain experiment (sample JH152) were measured using the backscattered electron images taken from the JSM-7100F FE–SEM. x: shear direction; z: direction normal to the shear plane; γ: shear strain of sample; N: number of grains.

Figure 5.
Pole figures of experimentally deformed chlorite. Pole figures of chlorite are presented in the lower hemisphere using an equal-area projection. The LPO of chlorite in the starting material is shown at the top. Sample names under low shear strain with the type-1 chlorite LPO are shown as red color, and other sample names under high strain with the type-2 LPO are shown as blue color. White arrows indicate the dextral direction of shear. N represents the number of grains. γ represents the shear strain of experiments, and a half-scatter width of 30° was used for the contours. The rounded contours in the pole figure represent the multiples of uniform distributions (m.u.d.), showing a fabric strength. x: shear direction; z: direction normal to the shear plane.

Figure 6.
Seismic velocity and anisotropy of experimentally deformed chlorite. Seismic velocity and anisotropy calculated from the chlorite LPO (Figure 5) are presented in the lower hemisphere using an equal-area projection. The P-wave velocity (Vp), amplitude of the S-wave anisotropy (AVs), and the polarization of the fast S-wave (Vs1) are plotted. The polarization direction of the vertically propagating fast S-wave (Vs1) is shown as bars at the center of the stereonet. x: shear direction; z: direction normal to the shear plane; γ: shear strain of sample.

Figure 7.
Change in seismic anisotropy due to the mixture of chlorite and serpentine. Seismic velocity and anisotropy were calculated using the LPO of the chlorite (sample JH100) and serpentine (sample VM3 of Jung [34]). Pole figures are presented in the lower hemisphere using an equal-area projection. The P-wave velocity (Vp), amplitude of the S-wave anisotropy (AVs), and the polarization of the fast S-wave (Vs1) are plotted. The polarization direction of the vertically propagating fast S-wave (Vs1) is shown as bars at the center of the stereonet. x: shear direction; z: direction normal to the shear plane; Chl: chlorite; Srp: serpentine.

Figure 8.
Seismic velocity and anisotropy of experimentally deformed chlorite with a dip angle (θ). Seismic velocity and anisotropy calculated from representative chlorite LPOs (type-1 (sample JH156, γ = 1.7) and type-2 (sample JH116, γ = 5.7)) (Figure 5) are presented in the lower hemisphere using an equal-area projection. The P-wave velocity (Vp), amplitude of the S-wave anisotropy (AVs), and the polarization of the fast S-wave (Vs1) are plotted. The polarization direction of the vertically propagating fast S-wave (Vs1) is shown as bars at the center of the stereonet. In the cartoon, the green plane represents the projection plane of pole figures, the green arrows represent the vertically propagating S-wave, and the red arrow represents the mantle flow direction. x: shear direction.

Figure 9.
Chlorite stability field and volume percentage. Based on the starting material (chlorite peridotite of Kim and Jung [38]), the stability field and volume percentage of chlorite were calculated using Theriak-Domino software [64]. The thick solid line represents stability field of chlorite. O(?) in bulk represents auto calculation of oxygen content in Theriak-Domino software. Chl: chlorite; Ol: olivine; Atg: antigorite; Di: diopside; Grt: garnet; Amp: amphibole; Opx: orthopyroxene; Phl: phlogopite; Prg: pargasite; Brc: brucite; Hc: hercynite; Chu: clinohumite; Mtc: monticellite; Ves: vesuvianite; phA: phase A.


Table 1.
Chemical composition of starting material minerals.
| Oxides (wt.%) | Olivine 1 | Chlorite 1 | Pyroxene 1 |
| NiO | 0.51 | 0.27 | 0.09 |
| K2O | 0.01 | 0.01 | 0.03 |
| Na2O | 0.02 | 0.01 | 1.58 |
| FeO | 13.18 | 3.99 | 2.67 |
| TiO2 | 0.02 | 0.04 | 0.12 |
| SiO2 | 40.33 | 31.12 | 51.80 |
| MnO | 0.21 | 0.04 | 0.04 |
| CaO | 0.01 | 0.02 | 20.27 |
| Al2O3 | 0.02 | 17.70 | 4.97 |
| Cr2O3 | 0.02 | 1.45 | 0.89 |
| MgO | 47.51 | 31.75 | 16.75 |
| Sum 2 | 101.77 | 86.36 | 99.16 |
| Cations | Olivine1 | Chlorite1 | Pyroxene1 |
| Ni | 0.01 | 0.02 | 0.00 |
| K | 0.00 | 0.00 | 0.00 |
| Na | 0.00 | 0.00 | 0.11 |
| Fe2+ | 0.27 | 0.32 | 0.08 |
| Ti | 0.00 | 0.00 | 0.00 |
| Si | 0.99 | 2.98 | 1.89 |
| Mn | 0.00 | 0.00 | 0.00 |
| Ca | 0.00 | 0.00 | 0.79 |
| Al | 0.00 | 2.00 | 0.21 |
| Cr | 0.00 | 0.11 | 0.03 |
| Mg | 1.74 | 4.53 | 0.91 |
| Sum | 3.01 | 9.97 | 4.04 |
| O | 4.00 | 18.00 | 6.00 |
1 The average of three electron probe micro analyzer (EPMA) measurements for each mineral. 2 Includes uncertainty of ±1.5%.
Table 2.
Experimental conditions and results of experimentally deformed chlorite.
| Sample | Pressure (GPa) | Temperature (°C) | LPO Type of Chlorite | Shear Strain | Strain Rate (s−1) | M-Index 1 | AVp 2 (%) | Max. AVs 2 (%) | Delay Time 3 (s) |
|---|---|---|---|---|---|---|---|---|---|
| JH101 | 0.5 | 650 ± 15 | Type-1 | 3.1 ± 0.3 | 2.65 × 10⁻⁶ | 0.479 | 21.9 | 42.8 | 0.4–2.7 |
| JH100 | 1.0 | 720 ± 20 | Type-1 | 1.9 ± 0.2 | 5.48 × 10⁻⁶ | 0.621 | 23.6 | 48.7 | 0.5–3.0 |
| JH154 | 2.0 | 570 ± 10 | Type-1 | 2.2 ± 0.5 | 6.41 × 10⁻⁶ | 0.510 | 20.4 | 37.0 | 0.4–2.3 |
| JH156 | 2.5 | 540 ± 10 | Type-1 | 1.7 ± 0.2 | 6.53 × 10⁻⁶ | 0.534 | 21.7 | 42.3 | 0.4–2.6 |
| JH116 | 0.5 | 650 ± 15 | Type-2 | 5.7 ± 1.0 | 9.68 × 10⁻⁶ | 0.075 | 11.0 | 16.2 | 0.2–1.1 |
| JH127 | 1.0 | 650 ± 15 | Type-2 | 5.1 ± 1.5 | 6.30 × 10⁻⁶ | 0.127 | 17.0 | 21.6 | 0.2–1.4 |
| JH138 | 1.5 | 650 ± 15 | Type-2 | 6.2 ± 1.7 | 6.26 × 10⁻⁶ | 0.256 | 16.6 | 21.3 | 0.2–1.4 |
| JH152 | 2.5 | 630 ± 10 | Type-2 | 6.3 ± 1.6 | 6.51 × 10⁻⁶ | 0.080 | 13.2 | 16.5 | 0.2–1.1 |
Table 3.
Seismic anisotropy and delay time of mineral mixtures.
| Sample | Mineral Mixture (%) | AVp 1 (%) | Max. AVs 1 (%) | Delay Time 2 (s) |
|---|---|---|---|---|
| JH156 | Ol (70) + Chl (30) | 13.1 | 19.3 | 0.2–1.2 |
| Ol (100) + Chl (0) | 11.4 | 9.4 | 0.1–0.6 | |
| JH116 | Ol (70) + Chl (30) | 11.7 | 12.1 | 0.1–0.8 |
| Ol (100) + Chl (0) | 15.7 | 11.2 | 0.1–0.7 | |
| JH100 | Chl (25) + Srp (75) 3 | 26.2 | 28.4 | 0.3–2.0 |
| Chl (37.5) + Srp (62.5) 3 | 25.3 | 28.7 | 0.3–2.0 | |
| Chl (50) + Srp (50) 3 | 24.7 | 30.4 | 0.3–2.1 | |
| Chl (62.5) + Srp (37.5) 3 | 24.2 | 33.4 | 0.4–2.2 | |
| Chl (75) + Srp (25) 3 | 23.9 | 37.6 | 0.4–2.4 |
© 2020 by the authors. Licensee MDPI, Basel, Switzerland. This article is an open access article distributed under the terms and conditions of the Creative Commons Attribution (CC BY) license (http://creativecommons.org/licenses/by/4.0/).
Share and Cite
MDPI and ACS Style
Kim, D.; Jung, H.; Lee, J. Strain-Induced Fabric Transition of Chlorite and Implications for Seismic Anisotropy in Subduction Zones. Minerals 2020, 10, 503. https://doi.org/10.3390/min10060503
AMA Style
Kim D, Jung H, Lee J. Strain-Induced Fabric Transition of Chlorite and Implications for Seismic Anisotropy in Subduction Zones. Minerals. 2020; 10(6):503. https://doi.org/10.3390/min10060503
Chicago/Turabian StyleKim, Dohyun, Haemyeong Jung, and Jungjin Lee. 2020. "Strain-Induced Fabric Transition of Chlorite and Implications for Seismic Anisotropy in Subduction Zones" Minerals 10, no. 6: 503. https://doi.org/10.3390/min10060503
Note that from the first issue of 2016, this journal uses article numbers instead of page numbers. See further details here.