Energy
Animation: The World’s Biggest Wind Turbines
![]() Subscribe to the Elements free mailing list for more like this
Subscribe to the Elements free mailing list for more like this
The World’s Biggest Wind Turbines
This was originally posted on Elements. Sign up to the free mailing list to get beautiful visualizations on natural resource megatrends in your email every week.
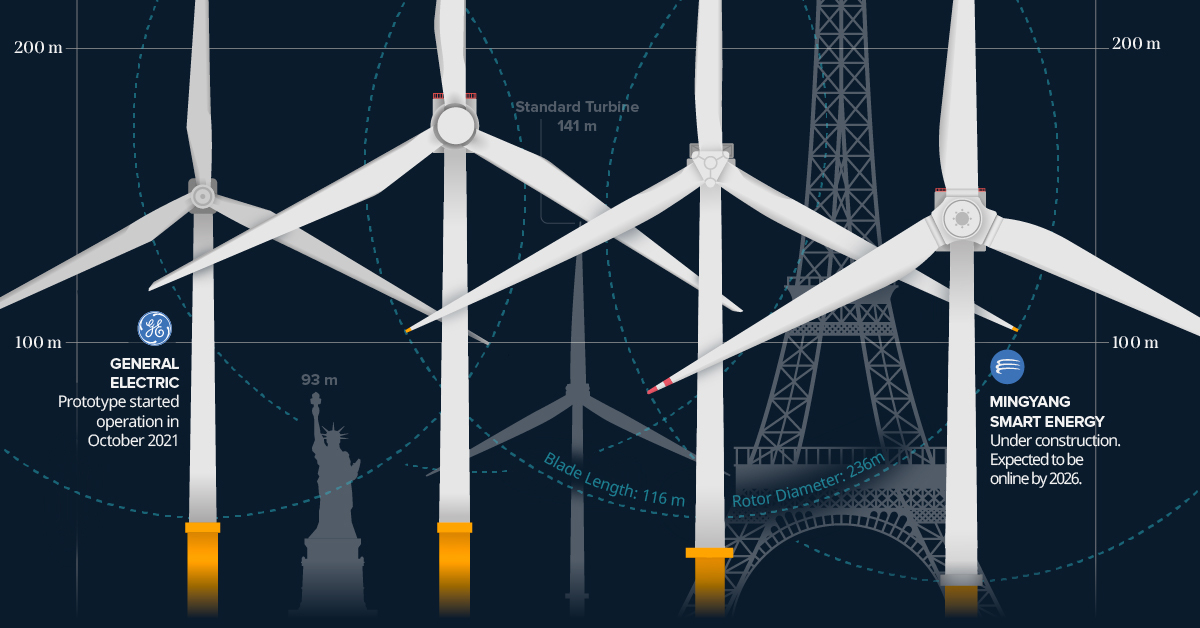
Since the early 2000s, wind turbines have grown in size—in both height and blade lengths—to generate more energy per unit.
Today, the tallest turbines can reach over 200 meters (650 ft) in height and cost more than $12 million to manufacture and install.
The above infographic uses data compiled from company portfolios to showcase the biggest wind turbines currently being developed and to put these huge structures into perspective.
Blade Runners
The biggest turbines are all located over water. The so-called offshore turbines can be taller than those onshore, which means they can harness more wind energy and produce more electricity.
MingYang Smart Energy, a Chinese wind turbine manufacturer, is in the process of building the biggest wind turbine so far.
Their new MySE 16.0-242 model is still under construction and is expected to be online by 2026. It will be 264 meters tall, with a blade length 118 meters long and rotor diameter of 242 meters. It features a nameplate capacity of 16 megawatts that can power 20,000 homes per unit over a 25-year service life. The first commercial turbine will be installed at the MingYang Yangjiang Qingzhou Four offshore wind farm, which is in the South China Sea.
Here are four of the biggest wind turbine models on the market right now, the companies that are making them, and where the prototypes are being installed:
| Model | Company | Nameplate capacity (MW) | Location | Height (m) | Blade Length (m) | Rotor Diameter (m) |
|---|---|---|---|---|---|---|
| MySE 16.0-242 | MingYang Smart Energy | 16 MW | 🇨🇳 | 264 | 118 | 242 |
| SG 14-236 DD | Siemens Gamesa | 14 MW | 🇩🇰 | Site Specific | 115 | 236 |
| Haliade-X | General Electric | 14 MW | 🇳🇱 | 260 | 107 | 220 |
| V236-15.0 | Vestas | 15 MW | 🇩🇰 | 280 | 116 | 236 |
These huge structures can be two times taller than a typical turbine currently in operation, generating almost four times more energy.
Prototypes for two of the top four turbine models—the SG 14-236 DD and V236-15.0— are scheduled to be installed in 2022 in Denmark, a country that was a pioneer in developing commercial wind power during the 1970s, and is home to the world’s largest wind-turbine manufacturer, Vestas.
From our list, General Electric’s Haliade-X is the only turbine currently online; the prototype has been operating since October 2021 in the Netherlands.
Wind Energy’s Rapid Global Growth
Wind generated 6.6% of the world’s electricity in 2021, up from 3.5% in 2015, when the Paris Agreement was signed, making it the fastest-growing source of electricity after solar.
A number of countries have achieved relatively high levels of wind energy penetration in their electricity grids.
Wind’s share of electricity generation was nearly 50% in Denmark and sits above 25% in countries such as Ireland, Uruguay, and Portugal. In the United States, wind supplied 8.4% of total electricity generation.
| Country | Wind Share of Electricity (%) |
|---|---|
| 🇩🇰 Denmark | 48% |
| 🇺🇾 Uruguay | 43% |
| 🇮🇪 Ireland | 33% |
| 🇵🇹 Portugal | 27% |
| 🇪🇸 Spain | 23% |
| 🇬🇧 United Kingdom | 21% |
| 🇩🇪 Germany | 20% |
| 🇬🇷 Greece | 20% |
| 🇰🇪 Kenya | 16% |
| 🇸🇪 Sweden | 16% |
Source: Ember’s Global Electricity Review 2022
Note: Countries with populations fewer than 3 million in 2021 were not included in this ranking.
The global wind turbine market size was valued at $53.4 billion in 2020 and is projected to reach $98.4 billion by 2030, growing at a CAGR of 6.3%.
As one of the fastest-growing segments of the energy sector, wind energy generation will continue to grow as wind turbines also scale up in size.


Who’s Building the Most Solar Energy?
This was originally posted on our Voronoi app. Download the app for free on iOS or Android and discover incredible data-driven charts from a variety of trusted sources.
In 2023, solar energy accounted for three-quarters of renewable capacity additions worldwide. Most of this growth occurred in Asia, the EU, and the U.S., continuing a trend observed over the past decade.
In this graphic, we illustrate the rise in installed solar photovoltaic (PV) capacity in China, the EU, and the U.S. between 2010 and 2022, measured in gigawatts (GW). Bruegel compiled the data..
Chinese Dominance
As of 2022, China’s total installed capacity stands at 393 GW, nearly double that of the EU’s 205 GW and surpassing the USA’s total of 113 GW by more than threefold in absolute terms.
| Installed solar capacity (GW) | China | EU27 | U.S. |
|---|---|---|---|
| 2022 | 393.0 | 205.5 | 113.0 |
| 2021 | 307.0 | 162.7 | 95.4 |
| 2020 | 254.0 | 136.9 | 76.4 |
| 2019 | 205.0 | 120.1 | 61.6 |
| 2018 | 175.3 | 104.0 | 52.0 |
| 2017 | 130.8 | 96.2 | 43.8 |
| 2016 | 77.8 | 91.5 | 35.4 |
| 2015 | 43.6 | 87.7 | 24.2 |
| 2014 | 28.4 | 83.6 | 18.1 |
| 2013 | 17.8 | 79.7 | 13.3 |
| 2012 | 6.7 | 71.1 | 8.6 |
| 2011 | 3.1 | 53.3 | 5.6 |
| 2010 | 1.0 | 30.6 | 3.4 |
Since 2017, China has shown a compound annual growth rate (CAGR) of approximately 25% in installed PV capacity, while the USA has seen a CAGR of 21%, and the EU of 16%.
Additionally, China dominates the production of solar power components, currently controlling around 80% of the world’s solar panel supply chain.
In 2022, China’s solar industry employed 2.76 million individuals, with manufacturing roles representing approximately 1.8 million and the remaining 918,000 jobs in construction, installation, and operations and maintenance.
The EU industry employed 648,000 individuals, while the U.S. reached 264,000 jobs.
According to the IEA, China accounts for almost 60% of new renewable capacity expected to become operational globally by 2028.
Despite the phasing out of national subsidies in 2020 and 2021, deployment of solar PV in China is accelerating. The country is expected to reach its national 2030 target for wind and solar PV installations in 2024, six years ahead of schedule.

-

 Economy7 days ago
Ranked: The Top 20 Countries in Debt to China
-

 Demographics2 weeks ago
The Countries That Have Become Sadder Since 2010
-

 Money2 weeks ago
Charted: Who Has Savings in This Economy?
-

 AI2 weeks ago
Visualizing AI Patents by Country
-

 Economy2 weeks ago
Economic Growth Forecasts for G7 and BRICS Countries in 2024
-

 Wealth2 weeks ago
Charted: Which City Has the Most Billionaires in 2024?
-

 Technology1 week ago
All of the Grants Given by the U.S. CHIPS Act
-

 Green1 week ago
The Carbon Footprint of Major Travel Methods